Across the Aimbase system are a series of ‘grid views’. A grid is a detailed list of something viewed in line-form, like an excel spreadsheet. Some of the most common grids used across Aimbase are the Leads Grid, Prospects Grid, HIT Grid, Dealer Grid and Registration Grid. Regardless of which grid you’re using, you’ll find that there are a lot of common features and tricks to navigating the grids which are detailed here.
Filters
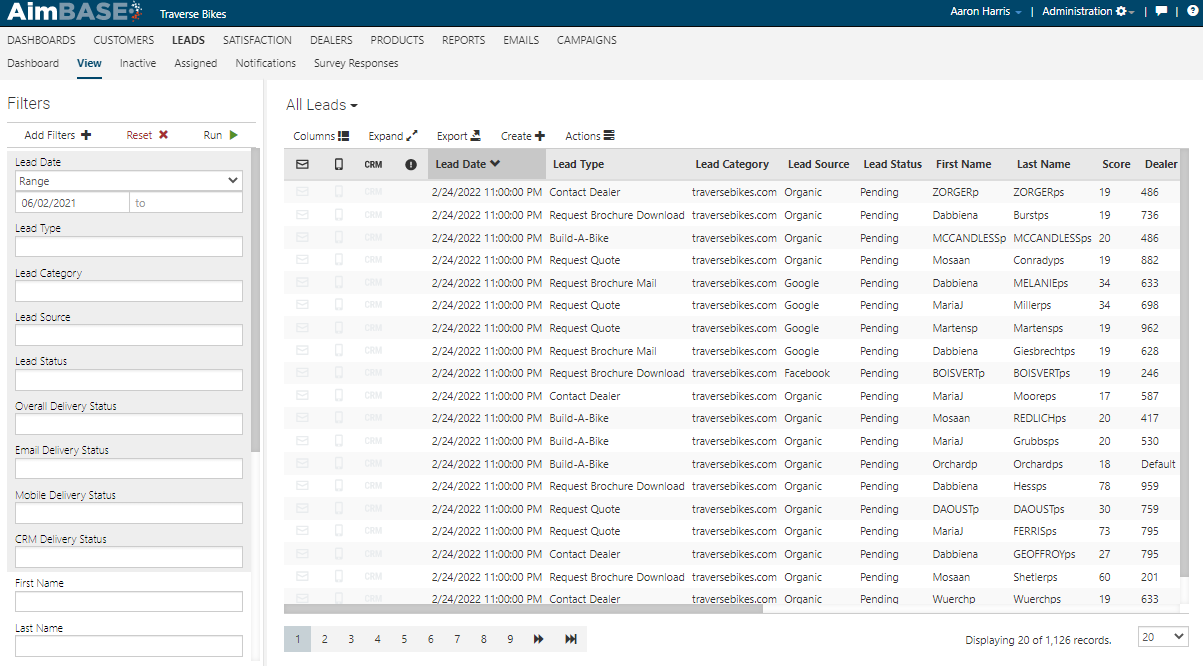
On the left side of each grid is a section for filters. These filters are intended for you to be able to look at subsets of data within the grid to understand trends and data counts better. Such filters as First Name/Last Name/Name, Email Address, Date(s) are common across most grids as a default. Depending upon the grid you’re using, the filters that appear by default will vary.
Each filter section will also have three buttons that appear above the filter fields: Add Filters, Reset and Run.
Filter Buttons
The buttons found within the Filters section of the grid can be used to add other filters, reset the filters to their default settings, and execute the filters you’ve put in place (Run).
Adding Filters – When adding a filter, click Add. This will open a window in the center of your screen with a list of the remaining filters that are not currently visible within the panel on the left. To add the filter, simply click on the one you want to add, and it will pop-up on the left-hand column. If you already have a lot of filters activated on the left, make sure to scroll to the bottom when looking for newly added filters.
Resetting Filters – As you’re moving from screen to screen within Aimbase, you might notice that there are times when your filters from a previous query on a grid are saved. When this happens and you want to get back to whatever the default settings are for a grid, simply click Reset. When you do this, all previously applied filters will be removed. If a filter was not originally on the default list of available filters, it will also be removed.
Run Queries – Once you’ve input all data into the filters you’d like to use, clicking Run will implement your query. Without clicking run, no data will be removed from the dataset you’re viewing.
Filter Field Usage
Depending upon the filter, you’ll notice that some require different types of data entry. Some filters will display a dropdown of options for you to choose from. Others will be open text fields. Make sure you’re aware of which type of filter you’re using at the time. Another example is when you’re filtering using numeric values. Often filters like this will first require you to choose ‘Equals’, ‘Less Than’, or ‘Greater Than’ before you input a number in the field.
Removing Single Filters
To stop utilizing a specific filter on the list, you can utilize two different methods:
Remove whatever value currently exists in the filter box so that it is blank and click Run again.
Hover over the filter until the small gray X appears and click the X to remove the filter from the list. This is also helpful when the list of filters is very long. If you’re not using it, it might just be easier to remove it from the view.
Sorting Grid Data
At the top of each grid are the column headers, which let you know what data points you are viewing. By clicking on these headers, you can sort the data within the column by ascending or descending order. Clicking once sorts the column by ascending order, clicking the header a second time will reverse it and sort the data by descending order.
Saved Grid Views
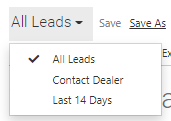
This feature allows you to save a grid configuration after you’ve made any of the changes mentioned above. This is helpful if you have a specific view or dataset you often want to see. Once you’ve enabled/disabled any columns you do or don’t need and rearranged them to the order you find most useful, click Save to save changes to a current view, or click Save As to create a new view. Type a ‘View Name’ in the field and click Save. Once you’ve done this, you can select your saved view from the list any time you return to that specific grid view. Any filters you have turned on when saving the view will also be included.
Creating a View
Saved View Examples
1. Creating a Contact Management Queue
2. Out of Network/Unassigned Lead Example
3. Mailed Brochure Fulfillment
Other Grid Features
Within the grid data you’ll see a title informing you of the type of data you’re looking at. Some examples are Leads, Registrations, Dealers, Products, Prospects, etc.
Below this title you’ll find a series of buttons which each represent a different feature.
 Columns – When you click columns, a window will appear with a list of all the possible columns that can show on the grid. The ones that are currently showing will have a check. You can add any columns (data points) to the grid view here by checking an unchecked box. You can also rearrange the columns as they appear on the grid from this screen. Do this by hovering over the row until the cursor with four arrows appears and then click and drag the items into the order you want them to appear.
 - The Expand icon is used to make all columns visible on the grid at one time. This feature will make all available columns relevant to the dataset visible at one time. When expanded, you’ll likely need to use the scroll bar that appears at the bottom of the page.
 - The Export function allows you to pull data out of Aimbase formatted as either an Excel spreadsheet or a CSV file. When exporting, only the data in the visible columns and whatever you’ve filtered down to will be exported. Be sure you’ve configured the data exactly as you want it before exporting.
If the number of records you’re exporting at one time exceeds 10,000, clicking ‘export’ will result in a screen asking you for your email address. Larger data exports such as these require more time to process (typically the data is available within 5-10 minutes, depending on the number of records you’re exporting). When these larger files have completed processing, you’ll receive an email with a link to download the file. You can also find the export within Aimbase by going to Administrations > Data Exports > Exports.
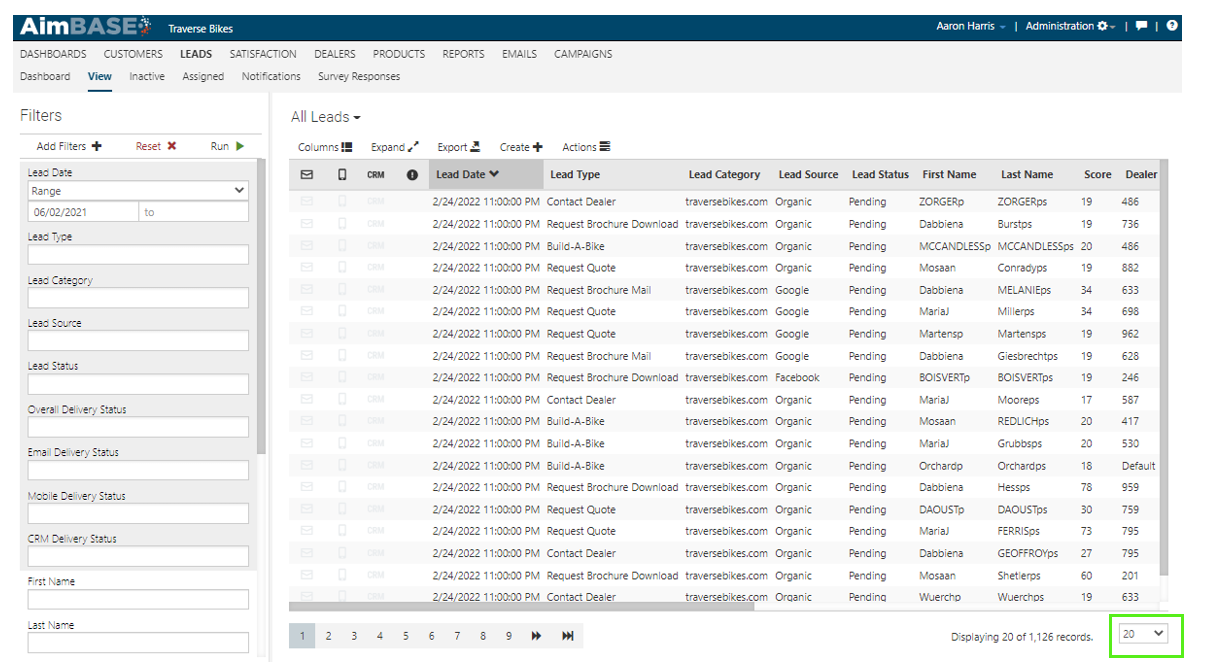
At the bottom-right corner of the page you’ll find a count of the total records returned by the current query and a dropdown on each grid. The dropdown can be used to toggle between seeing 20, 50 or 100 records at a time.
FAQ's
What is a “grid” in Aimbase?
A grid is a detailed list of data displayed in a line format, similar to an Excel spreadsheet.
What types of grids are commonly used?
Common examples of grids in Aimbase include:
- Leads Grid
- Prospects Grid
- HIT Grid
- Dealer Grid
- Registration Grid
- Survey Response Grid
Do all grids work the same way?
Yes. While different grids display different types of data, they share common features and navigation behaviors that apply across the system.
What are filters used for in a grid?
Filters allow users to view specific subsets of data so they can better understand trends and data counts within the grid.
Where are filters located?
Filters are located on the left side of each grid.
What are some common default filters?
Common default filters can include:
- First Name / Last Name / Name
- Email Address
- Date(s)
What are the main filter buttons and what do they do?
Each grid includes three main filter buttons:
- Add Filters – Opens a list of additional filters not currently shown
- Reset – Returns filters to their default state
- Run – Executes the selected filters to update the data view
What happens if I don’t click “Run” after adding filters?
If you don’t click Run, the filters will not be applied and no data will be removed or updated in the view.
How do I add a new filter?
Click Add Filters, then select a filter from the list that appears. The selected filter will be added to the left-hand panel.
What does the Reset button do?
The Reset button:
- Removes all applied filters
- Restores the grid to its default filter settings
- Removes any filters that were not part of the original default set
Why do my filters sometimes stay applied when I switch screens?
Filters can persist from a previous query when moving between screens. Using Reset clears them and returns the grid to its default state.
Do all filters work the same way?
No. Filters can require different types of input:
- Some use dropdown selections
- Some use open text fields
- Some require conditions (e.g., Equals, Less Than, Greater Than) before entering a value
What should I know about numeric filters?
Numeric filters often require you to:
- Choose a condition (e.g., Equals, Less Than, Greater Than)
- Enter a numeric value to complete the filter