
What is LENS?
Utilizing a mixture of the web activity, lead activity, campaign and HIT activity that Aimbase already collects, Lens aggregates this data and gives users a new view into the prospect. Instead of navigating a prospects activity line by line (via the HIT grid or the Timeline tab), you can quickly learn what the prospect is interested in with the rolled up view of the data provided on the Lens tab.
Lens uses the data for a prospect over the last 30, 60, 90 days, or up to a full year of information. It helps you analyze where the prospect is in their decision-making process, how much research her or she has done.
What is Web Session Data?
Aimbase tracks users on your site utilizing a simple snippet of code. It can also track over multiple sites that are owned by your brand, as long as that snippet is there. This allows Aimbase to have visibility to where and when the prospect went across each website. Often, prospects have multiple visits. Each visit can tell us different things.
For example, looking at this data shows us that this prospect navigated to the website via a campaign: Promotion Road 2020. The prospect was specifically interested in a Rider bike and went to the brochure request page.
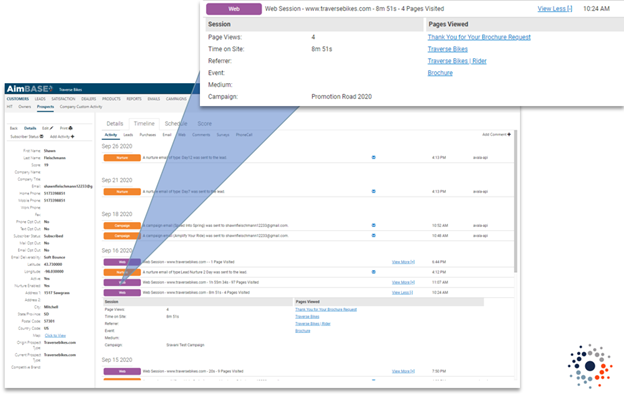
Previously, the only way to analyze this data was to look line-by-line at each individual web session. With Lens, we are giving you a quick insight into how long they have been on the site, and which products and product segments they are interested in.
Remind Me - What is HIT?
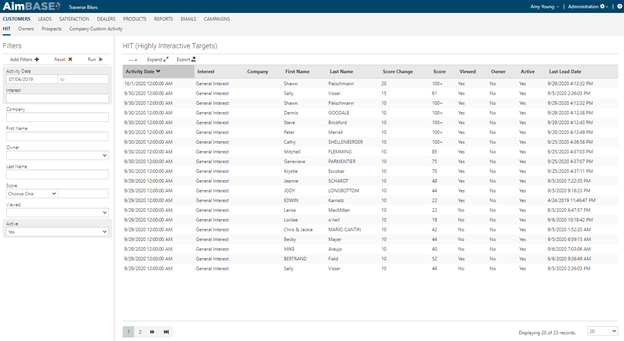
HIT stands for highly interactive targets. Aimbase uses its ability to read data from cookies it places within consumers’ browsers to identify when the consumers continue to interact with a brand. Looking deeper into each of these HIT records allows dealers and OEMs to gauge where that consumer might be in his/her purchase process and/or if he/she is a qualified buyer.
Segments should be set up to have a General Interest, and then segmented further based on what data points are of interest for based on how you structure your brand website and/or product line(s).
The HIT records include activities that are triggered by prospects opening an email, clicking a link in an email (when sent from Aimbase), and revisiting a brand’s website. HIT records will only appear on the grid if the activity occurs on a day that the prospect has not also submitted a lead. Because this activity can also be triggered by interaction with a campaign email* it is possible that a prospect could have HIT activity without ever having entered a lead.
HIT activity is logged on the HIT grid, which you can find under the Customers section of Aimbase. For a record to appear on this grid, the prospect must have a positive change in their score. These increases are caused by interactions with emails or repeat visits to a brand’s website.
*Assumes that campaign emails are sent to lists that are made up of contacts not exclusively derived from lead activity.
How Are Segments Used?
Segments are a simple division of data that creates powerful knowledge within Aimbase. Dividing web page visits into specific segments can allow for filtering based off the data and targeting people with specific segments for campaigns. For example, if you have a segment set up for Mountain Bikes, you can filter all people interested in Mountain Bikes and then send them a campaign about a newly released Mountain Bike.
Alerts can be set up to get a summary of people entering segments. These can be sent per specific segment or as an overall alert. These alerts tell you the day after the prospect browses the web but does not submit a form. While utilizing this data, it’s important to remember how not to be creepy.
How Should You Define Segments?
It can sound overwhelming to determine how to segment your customers, but there is a simple way to start. It is easy to segment into general areas of interest simply using your website and looking at how the navigation is structured. You can always start with General Interest as a main segment, basing that off the person hitting the homepage. Then, look at how your website is organized. A lot of thought has been put into organizing the website to give the best customer experience to your users. Start with those.
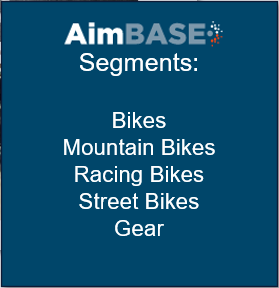
For example, on Traverse Bikes, the website is already “segmented” out for us.
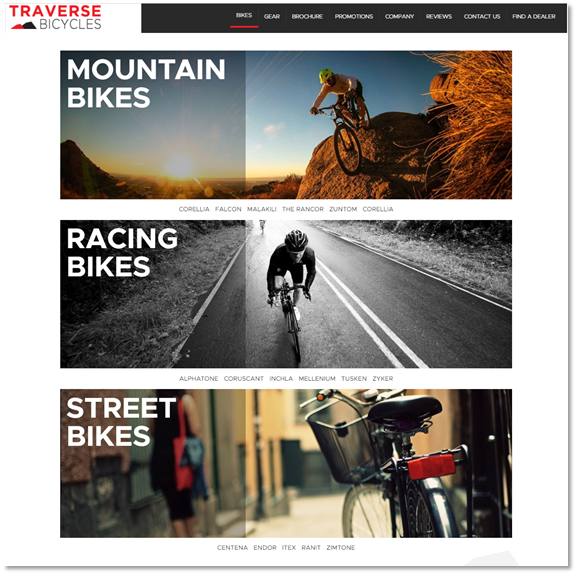
Looking at this page, we can see on the top navigation that Bikes and Gear are two main segments. Once you click on Bikes, its segmented out even further into types of bikes. Simply looking at the website gives a great initial segmentation:
Once we start collecting data, there may be another natural split that we find that can be easily added and updated. Segments should be treated as fluid—you do not want to “set and forget” them. Instead, they should be continually improved.
What Information is Within LENS?
Now that all the data behind the Lens is explained, we can take a look at the Lens screen in more detail, including calculations and more.
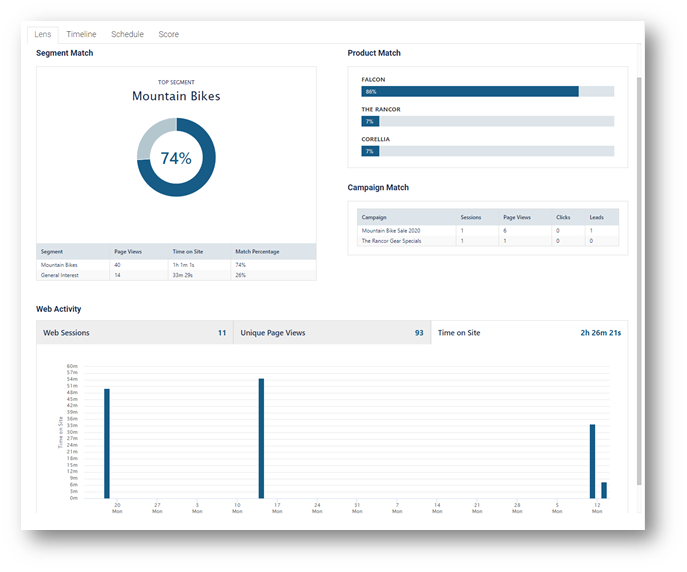
Lens uses all the data we talked about to summarize a prospect’s interest and activities. Instead of trying to analyze each line of activity, you can look at a single screen which tells you a lot about the prospect. It is derived of four major parts: Segment Match, Product Match, Campaign Match, and Web Activity.
What Does Segment Match Mean?
Segment match is based on the segments the prospect has entered. The better the data is segmented, the more the data tells you about the consumer. It displays the top segment of interest within a time frame shows all segments the person has entered.
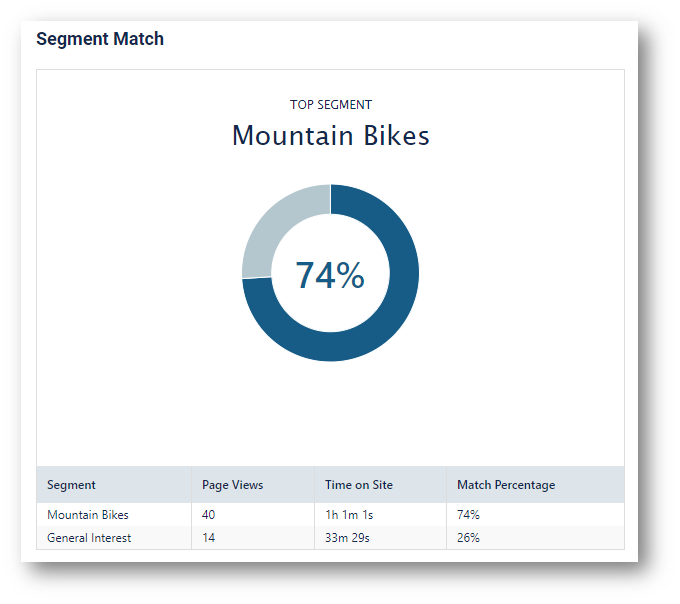
One thing to note is that this is showing all segments the person has entered, and all page views that pertain to the segment selected. Therefore, the page views may overlap. Meaning, General Interest and Mountain Bikes may be defined on one page, and the page view and time on site would both be counted on each line. This all depends on the data set up. There are cases in which you may want to have two segments on one page, and that is a practice that is fine to follow. For example, you could have a Trade-In segment along with a Mountain Bike segment. If someone were on a page to calculate the trade-in value for a Mountain Bike, it makes sense to have both segments on this page. That particular visit would be counted in this graph on both lines.
What Does Product Match Mean?
Product match contains a simple weighting algorithm that we will build on as more data comes in. On Lens, it shows what product the prospect is most interested in via a graph.
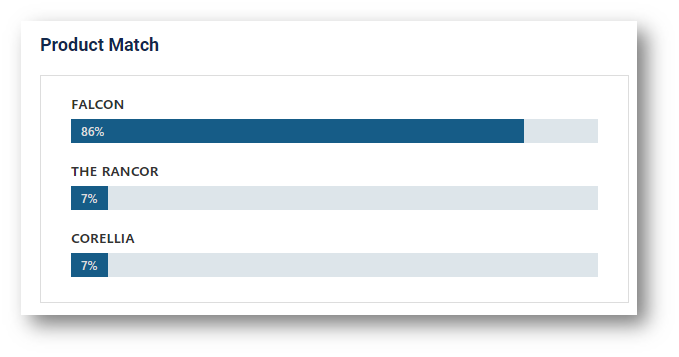
Up to three products will display on the graph, and the rest of the products that the prospect has shown interest in will display rolled up into “other”. The products are rolled up based on product name for this graph.
What Does Campaign Match Mean?
The campaigns section of the Lens shows an Aimbase user what campaigns this prospect is most active in by displaying sessions, page views, clicks, and leads that belong to that campaign. A campaign only shows on this graph when the prospect has activity against it.
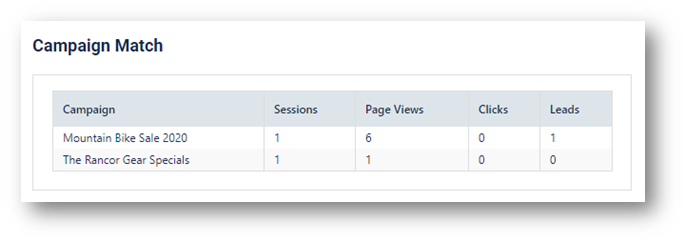
We can track campaigns at the web session level, and at the web page level. This means if someone comes in with a utm_campaign parameter from an email we sent out, or an ad that we are tracking, the campaign is appended to the web session. However, we can also track campaigns at the page level as well if you identify certain pages on your website that might be specific to some type of promotion.
What Does Web Activity Mean?
The web activity section on the Lens shows all web activity the prospect has completed in the time selected in the dropdown at the top of the page. If you hover over each line, it will expand on the information that is displayed with date and total number.
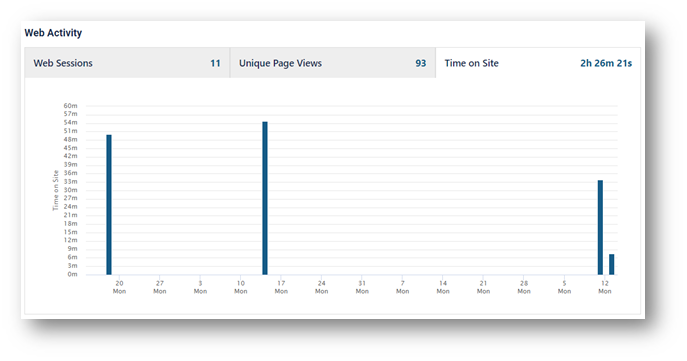
Web Sessions shows the number of times they visited the site and browsed around. A prospect could visit 10 pages, close out of the session and come back later that day to browse again, and that would count as two web sessions. This can be used to show how engaged the prospect is with the tracked site(s).
Unique Page Views shows the total number of unique page views they had during the time filtered. On this tab you'll see how many unique pages the visitor had within that time period, and combined with the other graphs on that page, gives insight into what they are most interested in overall.
Time on site shows how long the user has been on the tracked site(s) for the time period selected. This is down to the second. Bare in mind that we do not capture the time for the last page the user visited within the session because there is no way to determine at what time they closed their browser window.
FAQs
What is Lens and why should I use it?
Lens provides a summarized, rolled‑up view of a prospect’s activity in Aimbase. Instead of reviewing web sessions, HIT records, and campaigns line by line, Lens helps you quickly understand what a prospect is interested in, how engaged they are, and where they may be in their decision‑making process.
What data does Lens use?
Lens uses data Aimbase already collects, including:
- Website activity and web sessions
- Segment and product engagement
- Campaign interactions
- HIT (Highly Interactive Target) activity
This data can be viewed across selectable timeframes such as the last 30, 60, or 90 days, or up to a full year.
How does Aimbase track website activity?
Aimbase tracks website activity using a tracking script placed on your site. This allows Aimbase to see when prospects visit, what pages they view, and how long they stay across one or multiple brand‑owned websites that include the script.
What is a web session?
A web session represents a single visit to a tracked website. If a prospect visits the site, leaves, and later returns—even on the same day—each visit is counted as a separate session. Multiple sessions often indicate higher engagement.
Why doesn’t time on site include the last page visited?
Time on site is calculated using page‑to‑page activity. Because Aimbase cannot determine when a visitor closes their browser or tab, the time spent on the final page of a session is not captured.
What does HIT stand for and what does it mean?
HIT stands for Highly Interactive Target. HIT records identify prospects who continue interacting with a brand—such as revisiting the website or engaging with emails—without submitting a lead. These interactions help signal interest and buying intent.
Why might a prospect have HIT activity but no lead?
HIT activity can occur when a prospect opens or clicks a campaign email or revisits a tracked website without submitting a form. Because of this, a prospect may appear in HIT activity even if they have never submitted a lead.
When does HIT activity appear in Aimbase?
HIT activity appears in the HIT grid when a prospect’s activity results in a positive score change. HIT records only appear on days when the prospect did not also submit a lead.
What are segments and why are they important?
Segments are groupings of website activity that help organize prospect interests. By segmenting pages based on product categories or areas of interest, Aimbase can provide clearer insights and enable targeted follow‑up and campaigns. Well‑defined segments make Lens more informative and actionable.
Can a single page belong to more than one segment?
Yes. A page can belong to multiple segments if it makes sense contextually. For example, a page related to a Mountain Bike trade‑in may be assigned to both a “Mountain Bike” segment and a “Trade‑In” segment. Activity on that page will count toward both segments in Lens.
What does Segment Match show in Lens?
Segment Match displays the segments a prospect has entered within the selected timeframe. It highlights the prospect’s top areas of interest and shows how their page views and engagement relate to those segments.
What is Product Match?
Product Match uses a weighting algorithm to show which products a prospect is most interested in. Up to three products are shown individually, while additional products are grouped under “Other.” This view helps quickly identify product‑level interest.
How does Campaign Match work?
Campaign Match shows which campaigns a prospect has interacted with, including sessions, page views, clicks, and leads tied to those campaigns. Campaigns only appear in Lens when the prospect has recorded activity associated with them.
What is the difference between web session‑level and page‑level campaign tracking?
Campaigns can be tracked at:
- Web session level, such as when a prospect arrives via a tracked email or ad using UTM parameters
- Page level, when specific pages are identified as part of a promotion
Both methods help connect activity back to a campaign in Lens.
How often should segments be reviewed or updated?
Segments should be treated as flexible and evolving. As you collect more data and learn how prospects interact with your site, segments can be refined or expanded to improve insights and targeting.
How should I use Lens without being “creepy”?
Lens is designed to provide insight, not surveillance. Use the data to better understand interests and timing, and apply it thoughtfully when following up or creating campaigns—especially when prospects have not yet submitted a lead.