Overview
The enhanced dashboard is a collection of widgets that are designed to consolidate marketing and satisfaction data into one view. The goal of the widgets is to provide actionable data for the users so they can see which leads haven't been opened, dealer response activity and/or the satisfaction scores for the quarter, as well as uncompleted tasks and conversations that need replies for the contact management users.
The dashboard is located as a top-level navigation.

Below are some general rules that apply to the data that appears within the widgets.
Data set: All widgets display data from the previous day (not the current day) - this operates just like reporting.
Refreshing: There are 2 refresh options. One at the widget level which refreshes that specific widget, and the other at the page level refreshing all the widgets on the page.
Filtering: To use the filters, begin typing in the filter field to expose matched filter values. Once you've selected a filter value, you can continue typing in the box to search/add additional filter values. If you've added multiple filter values, you may see a + in the box. This indicates that there are additional filter values selected that are not visible.
Linking: Several widgets link to a corresponding report to allow the user a more in-depth analysis of the data. If this is available for the widget you're referencing you'll see View All in the bottom-right corner of the widget. If you've applied filters on the widget and you click the View All link, those same filters will be applied to the full version of the report.
Contact Management
Conversations
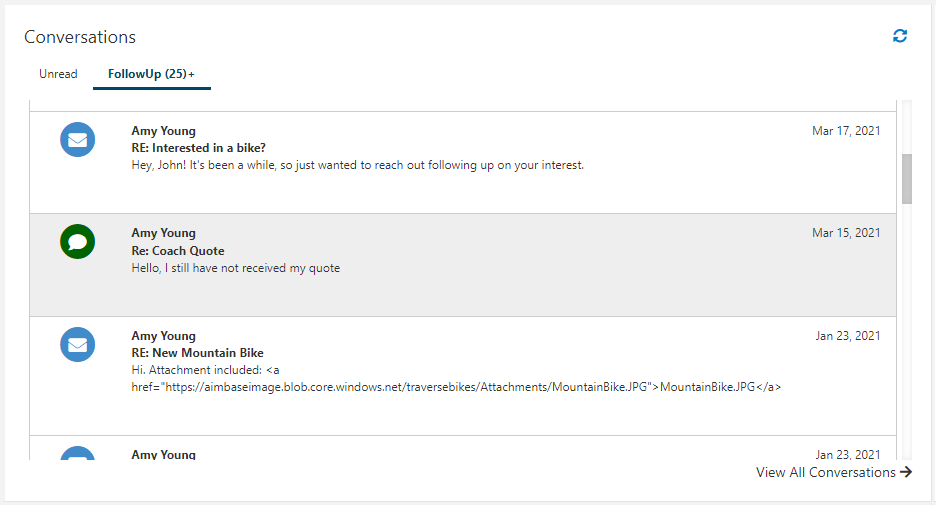
The Conversations widget is designed for contact management users to quickly see unread messages, which conversations haven’t been responded to, and conversations that require follow-up.
Details:
- The unread tab includes unread messages and messages where the contact manager has not responded to the prospect.
- The follow-up tab displays conversations where the user has not responded to the most recent message within (2) days.
- SMS messages where the prospect replies STOP will not be included in the Follow-up tab.
- Within these tabs we display the most recent 25 conversations for Unread and Requires Follow-up sorted by date.
- The View All Conversations link takes you to the conversations grid. By default, the grid will show all assigned conversations for the contact management user.
- The user can only see the conversations they are involved with.
- Clicking into a conversation will take you to that particular prospect’s conversation tab.
Tasks
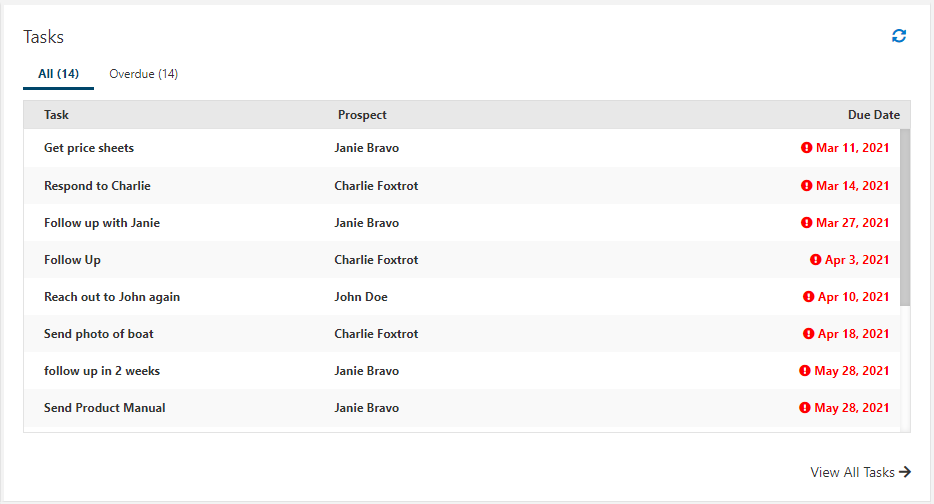
Contact Managers can leverage the task widget to quickly see all their tasks and filter to see all the overdue tasks.
Details:
- The task grid displays the first 25 incomplete or overdue tasks prioritized by due date. If there are more than 25, there will be a + indicator.
- Clicking into a task will take you to the task details – here users can edit, complete or delete the task.
- Any task with an overdue date will display a red due date value.
- Users can only see tasks they are assigned to based on their data permissions.
Marketing
Unopened Leads (90 days)
The Lead Unopened widget allows users to easily view and sort through leads that haven’t been opened and viewed by the dealer. The widget displays basic information such as Name, Lead Type, Product and Time Unopened. Under the main fields additional information will be provided such as Status of Lead, Lead Category and Lead Source.
At the top there are tabs available to filter the data you are viewing by This Week, Last Week or Older.
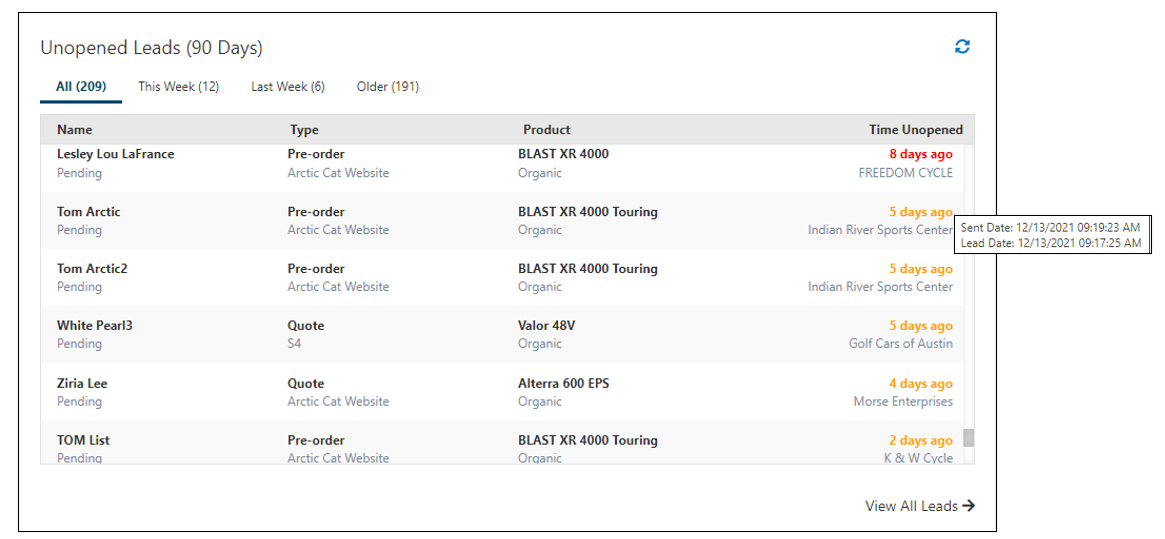
- Each record is clickable and takes you to the lead detail page.
- The Time Unopened column has a color indicator
- Green - even though the lead has not been opened, it is still within the acceptable time frame (2 days from when the lead enters Aimbase).
- Yellow - action should be taken soon to open the lead (2-4 days after the lead enters Aimbase).
- Red - the lead has passed the acceptable time frame to be opened and should be highest priority (7 days from when the lead enters Aimbase).
- There is a link in the bottom right-hand corner that will take you to the leads grid with the following filters applied - Sent to Dealer "Yes" and Viewed "No".
- Date range for weeks is Monday - Sunday.
Lead Delivery
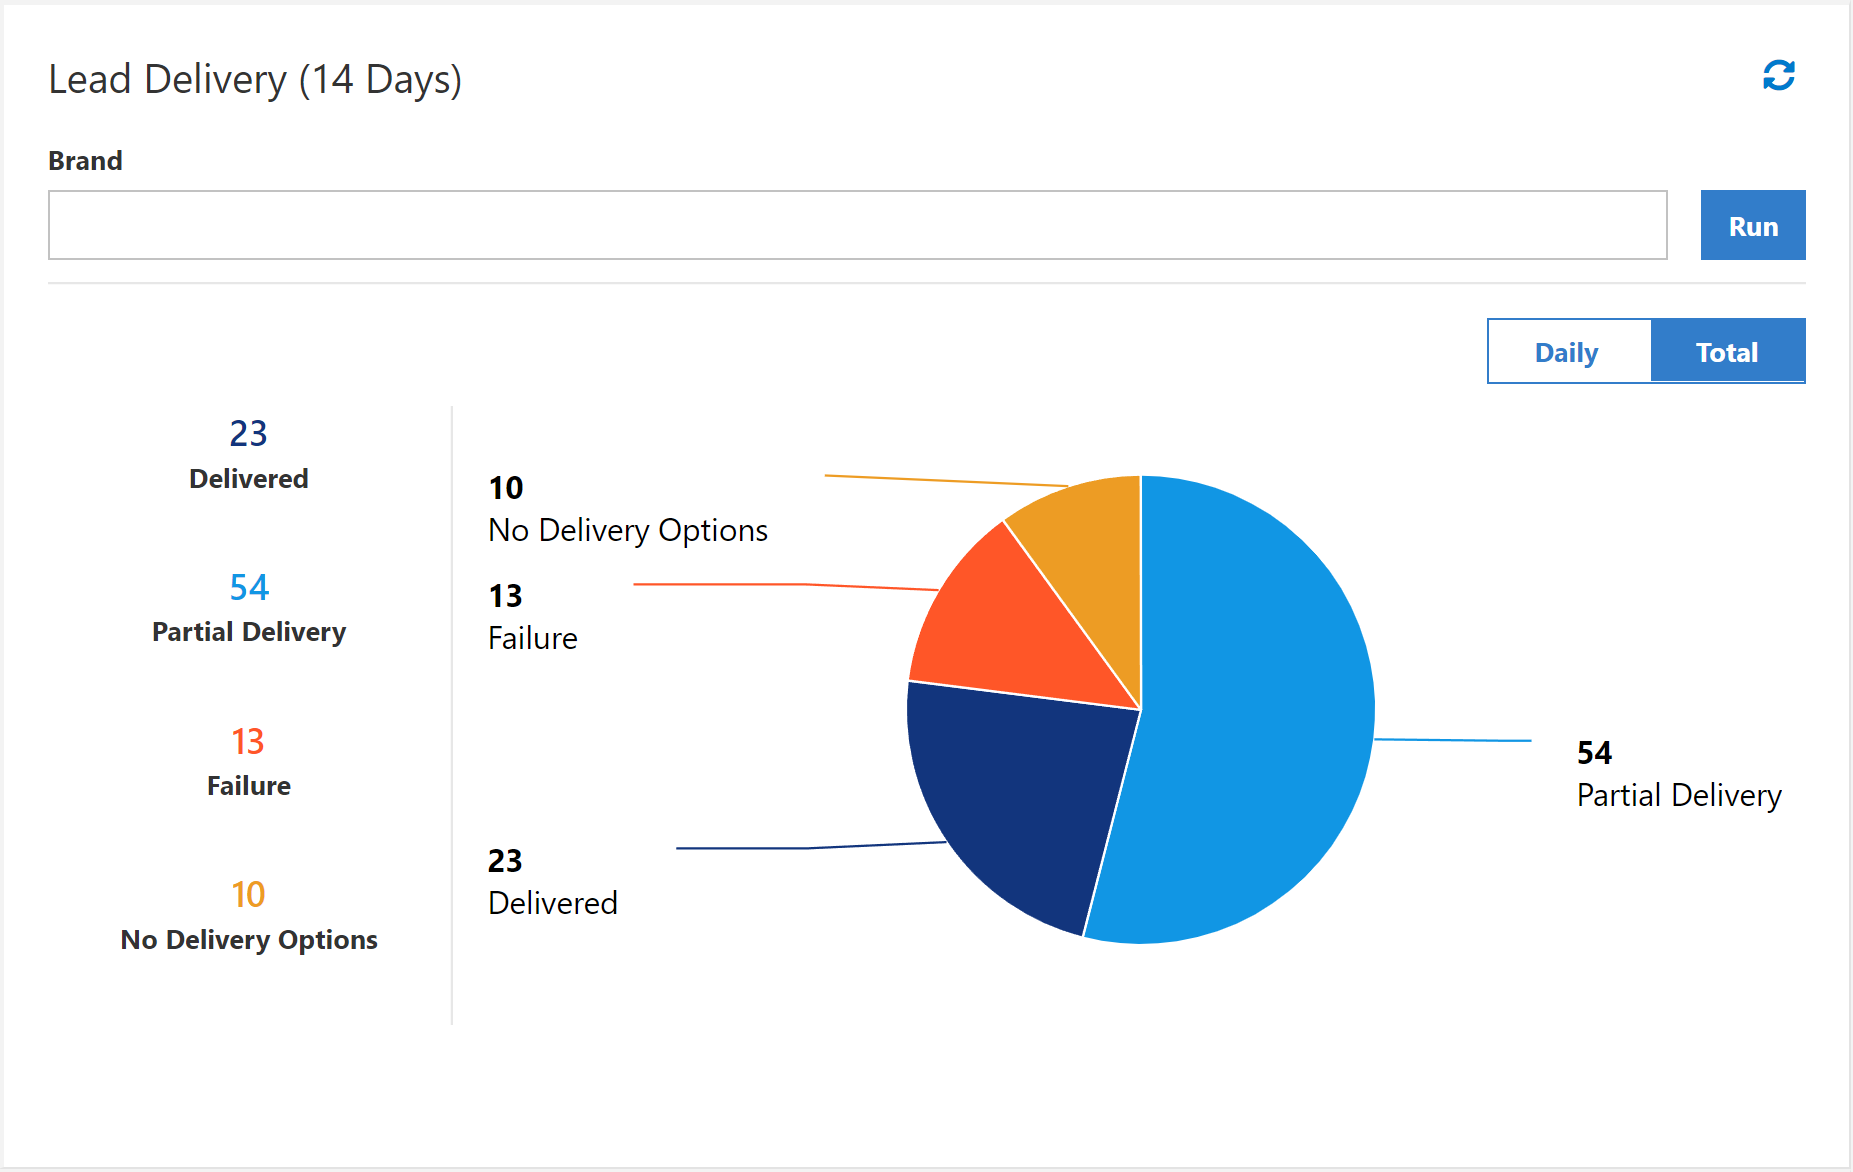
The Lead Delivery widget helps users monitor the delivery of their leads over the last 14 days. The widget allows for filtering at the brand level and has a toggle for Daily/Total Views. The Total view will show you the grand totals for all leads in the date range as a pie chart and the Daily view will show you the daily breakout of leads across each day, as well as the delivery statuses of those leads. All leads will fall into one of the following statuses and will be broken out as such on the widget:
- Delivered: All contacts received the lead.
- Partial Delivery: Some of the contacts received the lead
- Failed: No contacts received the lead.
- No Delivery Options: No lead email or integration delivery options available for dealer.
Clicking into either of the charts will take the user to the leads grid, which will be pre-filtered for the status/day that you clicked on.
25 Most Recent Active Prospects
This widget will display the prospects that have been most recently active. Aimbase defines recently activity by a positive net score change, which can be triggered by actions taken by the consumer (ex: clicking an email, visiting a web page, entering a lead, etc.).
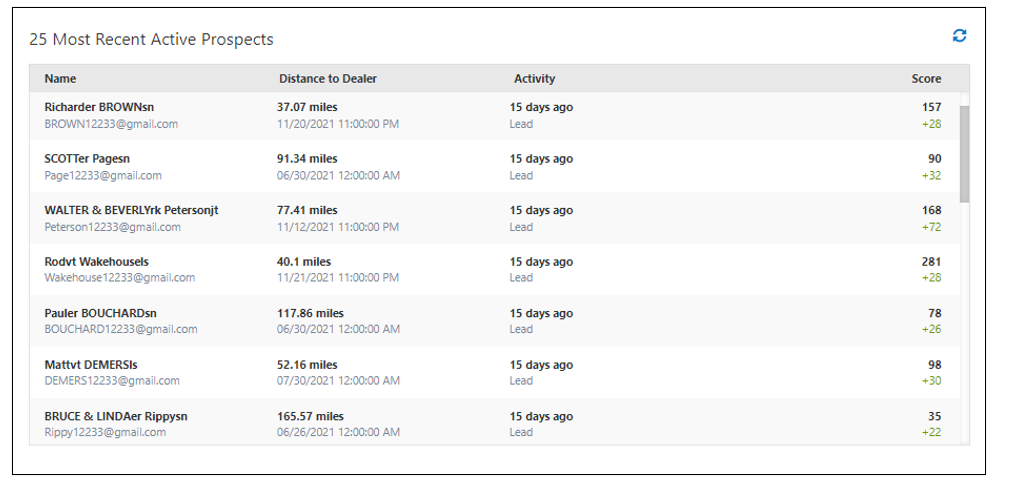
- Clickable a record will bring you to the prospect's timeline.
- Records are sorted based on activity date with the most recent first. Not by the prospect with the highest score.
- If a prospect has multiple activities over a couple of days, only the most recent is displayed. If a prospect has multiple activities in the same day, the widget will display all the activities in the sub-row within the Activity column.
- The top number in the Score column displays the total score for the prospect. The bottom number in the column displays the score change from the last activity. For example, yesterday the prospect made an appointment and the score increased by 75 points; therefore, the lower number will display as +75.
Dealer Response Activity
The Dealer Response Activity gives the user a snapshot of the the last 14 days of leads that have been sent, viewed and the avg. response time.
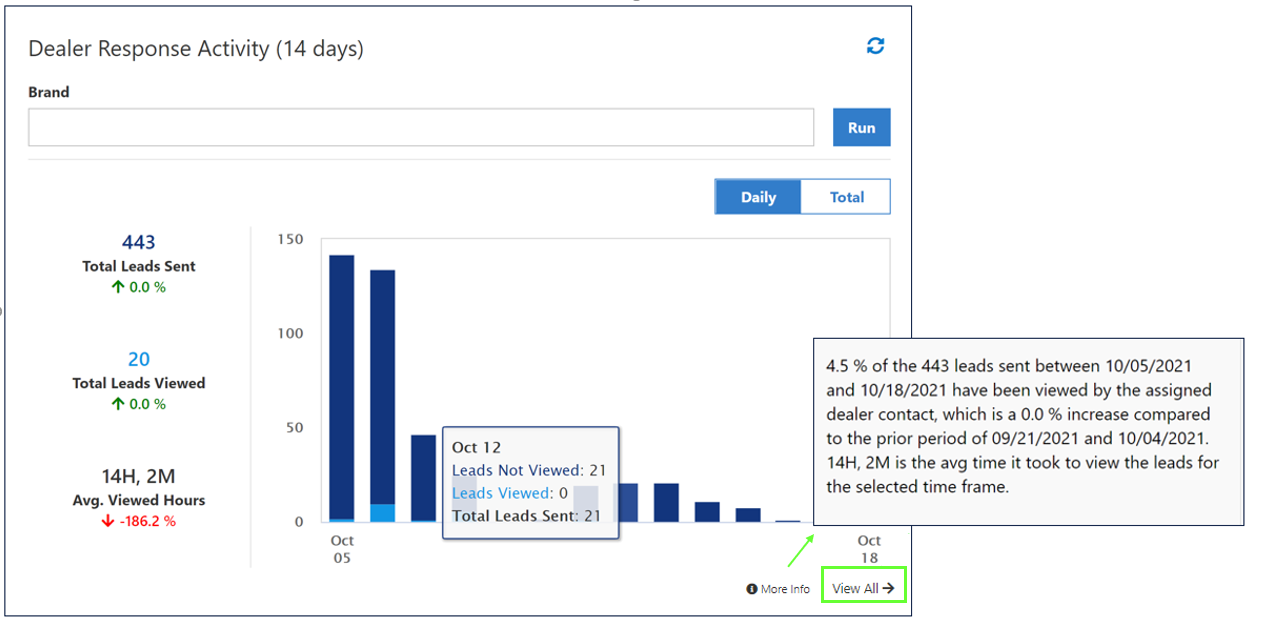
- Data will always display the last 14 days of data.
- The left-hand side displays the KPIs (Leads Sent, Viewed, Avg Viewed Hours).
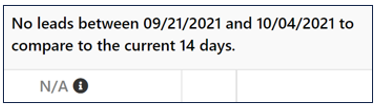
- Below the KPIs is a % that shows the variance from the 14 days shown in the widget compared to the 14 days prior. The variance displays the following:
- Green means an increase
- Red means decrease
- N/A, this means there aren’t any leads in the previous period’s range to compare against.
- On the graph there is a hover for each day that shows the total # of leads viewed, not viewed, and sent.
- Leads Viewed is defined as:
- The link in the Lead To email sent to the dealer is clicked by the recipient.
- Contact assigned to the lead has logged into Aimbase and viewed the lead from within Aimbase.
- The dealer is utilizing a CRM integration that provides disposition data back to Aimbase. The dealer has received the lead in their CRM and has indicated some interaction with the lead from within that system.
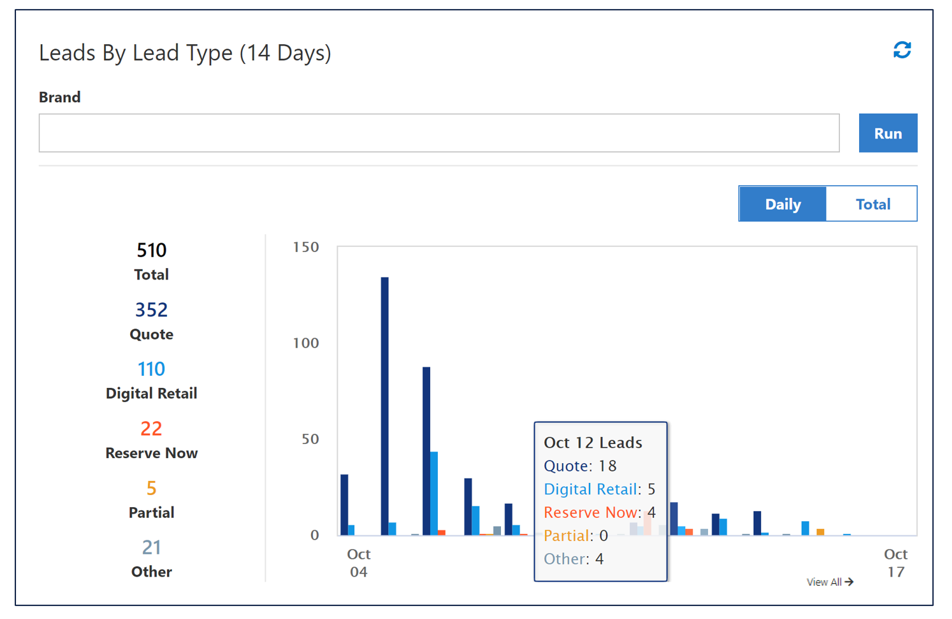
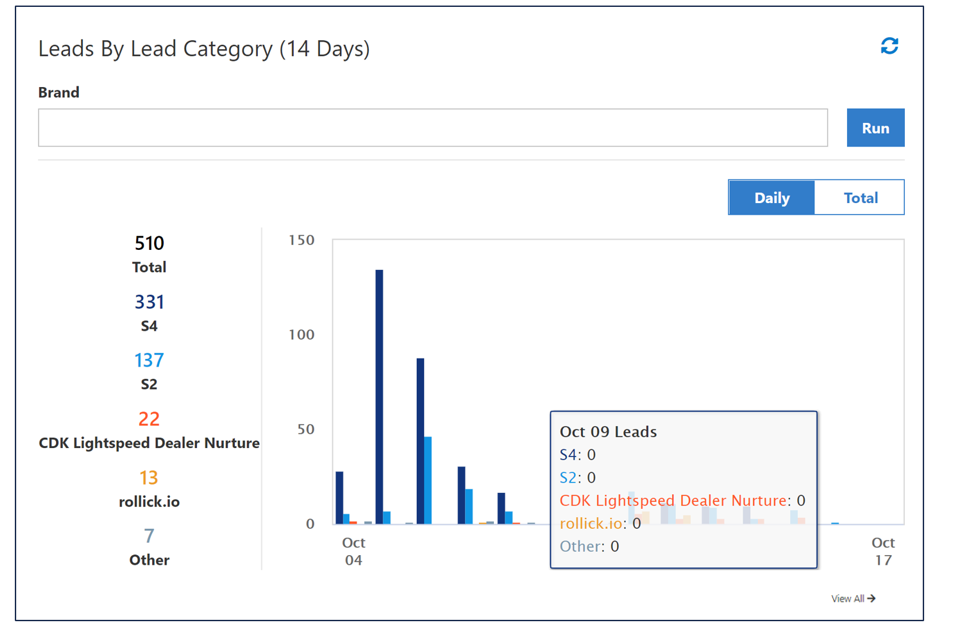
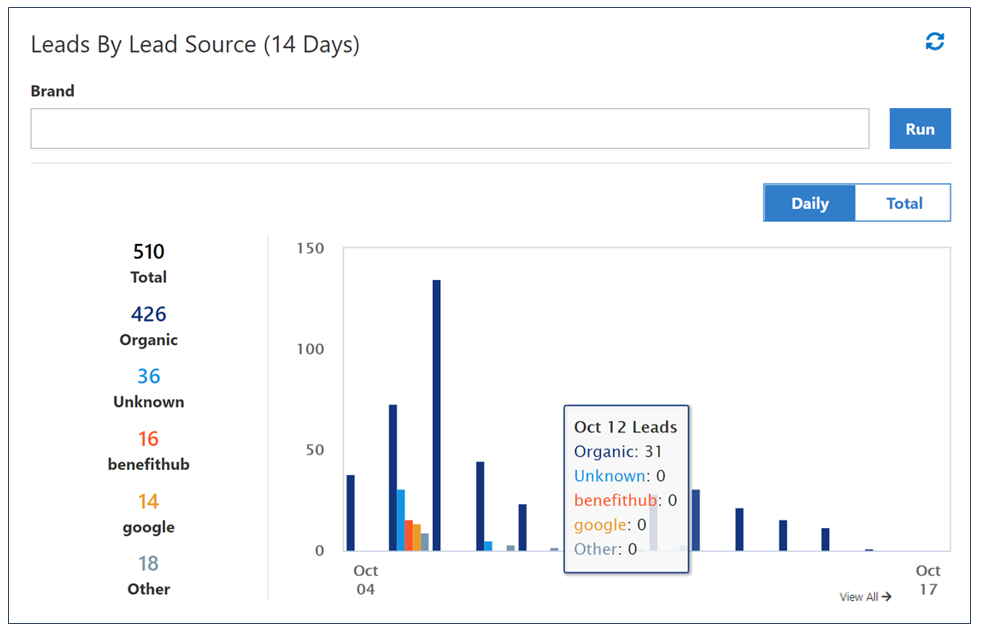
Lead Type, Source & Category
There are (3) separate lead widgets that displays lead counts by type, source and category. This provides the user with more detailed information to the various methods of categorizing the leads.
Details:
- Data will always display the last 14 days of data.
- The left-hand side displays the lead counts broken down by the type, source and category attributes.
- Each widget will display a max of the top 4 categories with the 5th being the "Other" category which will be a rollup of all the other attributes.
- If there isn't any data, then a message stating "No data available" will display to the user.
Owner Satisfaction
There are three separate satisfaction widgets that provide metrics for satisfaction score, recommendation and response rate. All data shown in the satisfaction widgets is shown in the current quarter. Each of these widgets can be filtered on Brand(s) and Survey Type(s) to drill down into the metrics.
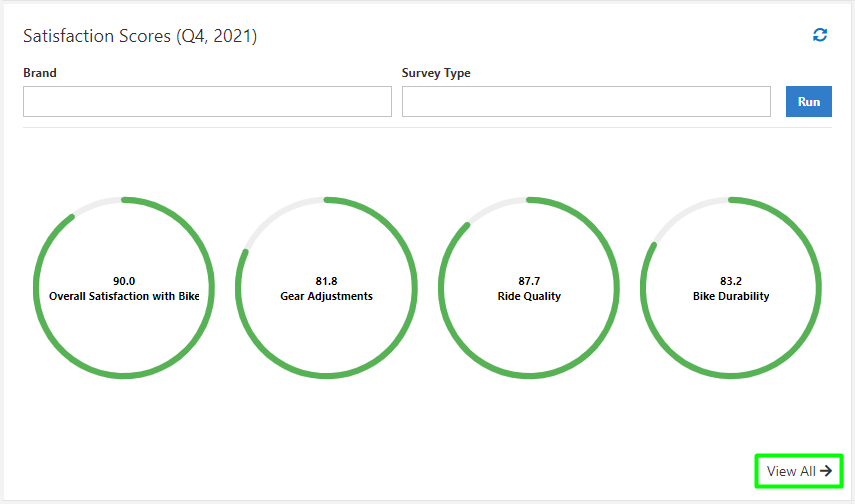
Satisfaction Scores
This widget provides metrics on how customers answered any overall satisfaction questions on your survey for the current quarter.
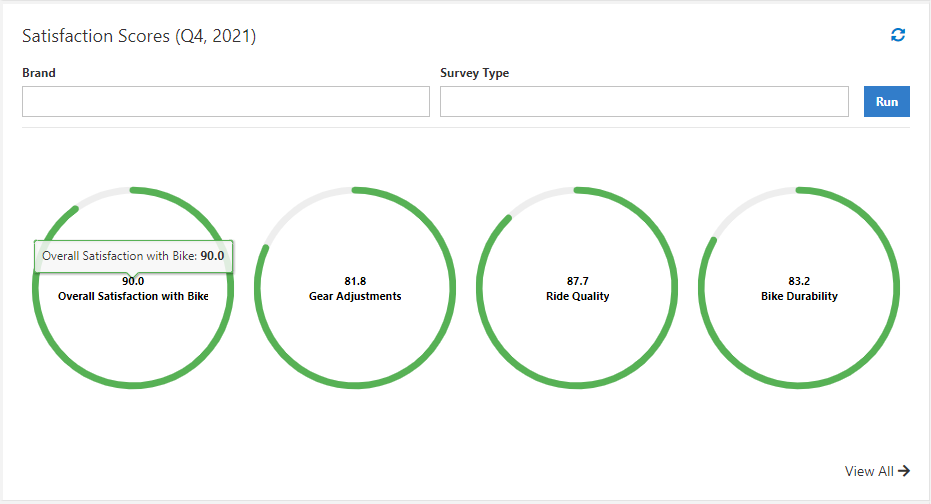
Details:
- The color scale is dependent on the range:
- 0-49 is represented by Red and indicates that the brand Needs Improvement.
- 50-79 is represented by Orange and indicates that the brand is Average.
- 80-100 is represented by Green and indicates that the brand is Excellent.
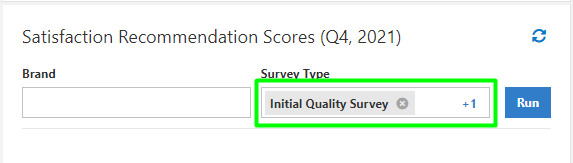
Satisfaction Recommendation
The recommendation scores reflect the customers response to the NPS (new promoter score) questions asked on the survey. These questions typically ask the customer how likely they are to recommend the brand, or selling dealer.
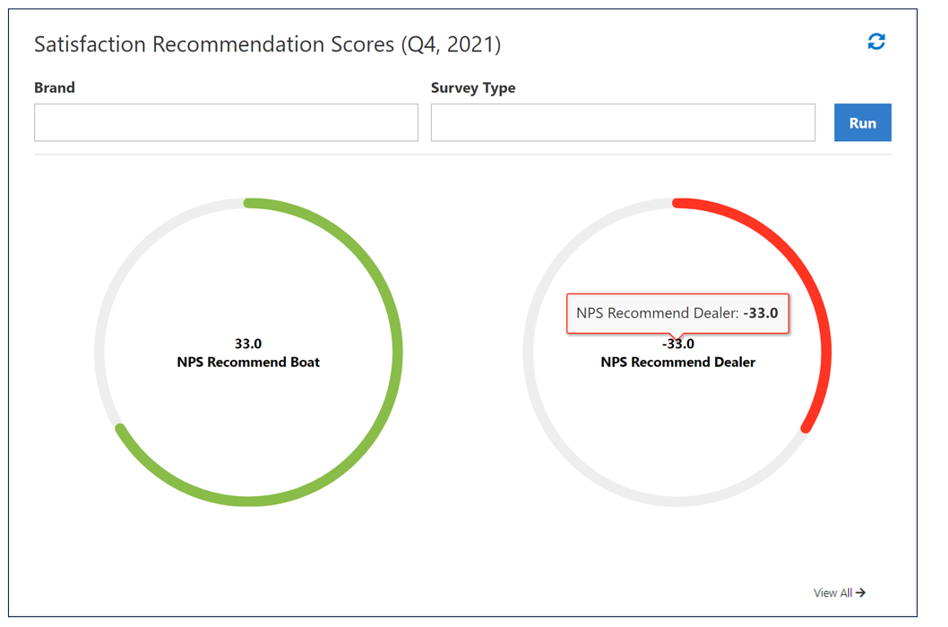
Details:
- The color scale is dependent on the range:
- 0-49 is represented by Red and indicates that the brand Needs Improvement.
- 50-79 is represented by Orange and indicates that the brand is Average.
- 80-100 is represented by Green and indicates that the brand is Excellent.
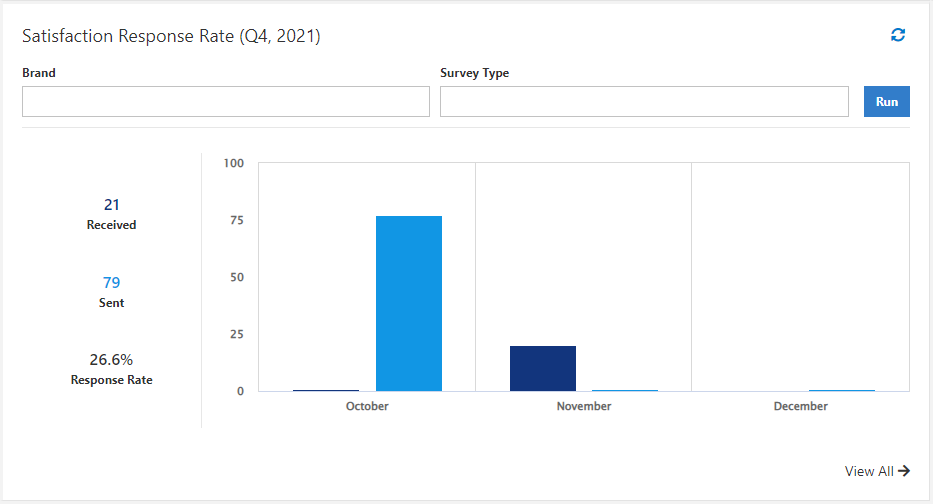
Satisfaction Response Rate
The response rate widget shows the number of surveys sent/received and response rate in the current quarter. The response rate is reflective of the month the response was received and is independent of the month during which it was sent. Example: A survey sent in September may be responded to on October. That response is reflected in Q4's response rate.
FAQs
What is the purpose of the Rollick Dashboard?
The enhanced dashboard consolidates marketing and satisfaction data into a single view using various widgets. These widgets provide actionable insights such as unopened leads, dealer response activity, satisfaction scores, and outstanding tasks or conversations requiring attention.
Where can I find the Dashboard in the platform?
The Dashboard is available as a top-level navigation item, making it easily accessible from anywhere in the system.
How current is the data shown in Dashboard widgets?
All widgets display data from the previous day, not the current day. This follows the same refresh pattern as system reporting.
How do Dashboard refresh options work?
There are two ways to refresh data:
- Widget-level refresh: Reloads only the selected widget.
- Page-level refresh: Reloads every widget on the page at once.
How do filters work in Dashboard widgets?
Begin typing in a filter field to reveal matching values. You can select multiple values, and if space is limited, a “+” symbol will indicate additional values that aren’t fully visible.
Do widgets link to more detailed reports?
Yes. Some widgets include a View All link that provides a deeper analysis in a corresponding full report. Any filters applied on the widget will automatically carry over to the full report view.
What does the Conversations widget show?
The Conversations widget provides quick visibility into:
- Unread messages or messages without a response
- Conversations requiring follow-up, defined as those without a user response within 2 days
It displays the 25 most recent conversations in each category. SMS messages where prospects reply “STOP” are excluded from the Follow-up tab.
Can all users see all conversations?
No. Users can only view conversations that they are directly involved with. The View All Conversations link opens the full grid, which shows all conversations assigned to the logged-in user.