
The contact management report is a helpful tool that allows you to measure the efforts of your contact management team. Here you'll find myriad modules that provide data regarding the volume of leads contacted, what days and times most of those message takes place, how messages each contact manager is sending and whether or not you're team is getting responses.
Watch the Full Recording
KPIs
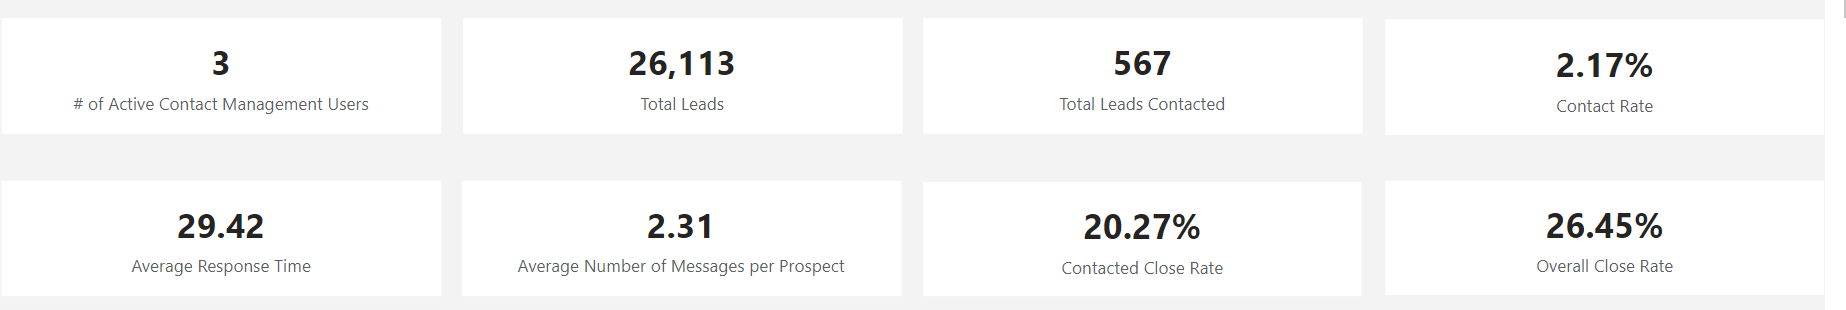
The KPIs at the top of the report give you a look at some of the top metrics. Below are explanations of each KPI.
# of Active Contact Management Users: This number reflects the number of active Aimbase users setup to utilize the contact management tool.
Total Leads: Here you'll find a count of total leads for the timeframe for which you ran the report. By default this is typically a R12 period.
Total Leads Contacted: This number reflects the number of leads your team has contacted. Depending on how you choose to utilize the tool, you may not expect every lead you receive to be contacted. Understanding the rules for which leads you expect your team to contact is important when referencing this number.
Contact Rate: Provides insight in the the overall percentage of leads contacted by your team.
Average Response Time: This metric is reflective of the average time (in hours) it takes for your team to send a message to the lead(s) being contacted.
Average Number of Massages per Prospect: Referencing this metric allows you to understand, on average, how many messages are being sent to each prospect when a contact management conversation occurs. These messages could be either emails or text messages depending upon the prospect.
Contacted Close Rate: The close rate metrics provide useful insight into what percentage of the prospects contacted eventually finalize a purchase. This metric is useful in measuring the effectiveness of the messages your team is sending.
Overall Close Rate: This metric provides an opportunity to compare the close rate of those prospects contacted to the close rate of your prospects overall. This is also helpful in considering the effectiveness of the contact management team.
Leads Contacted by User
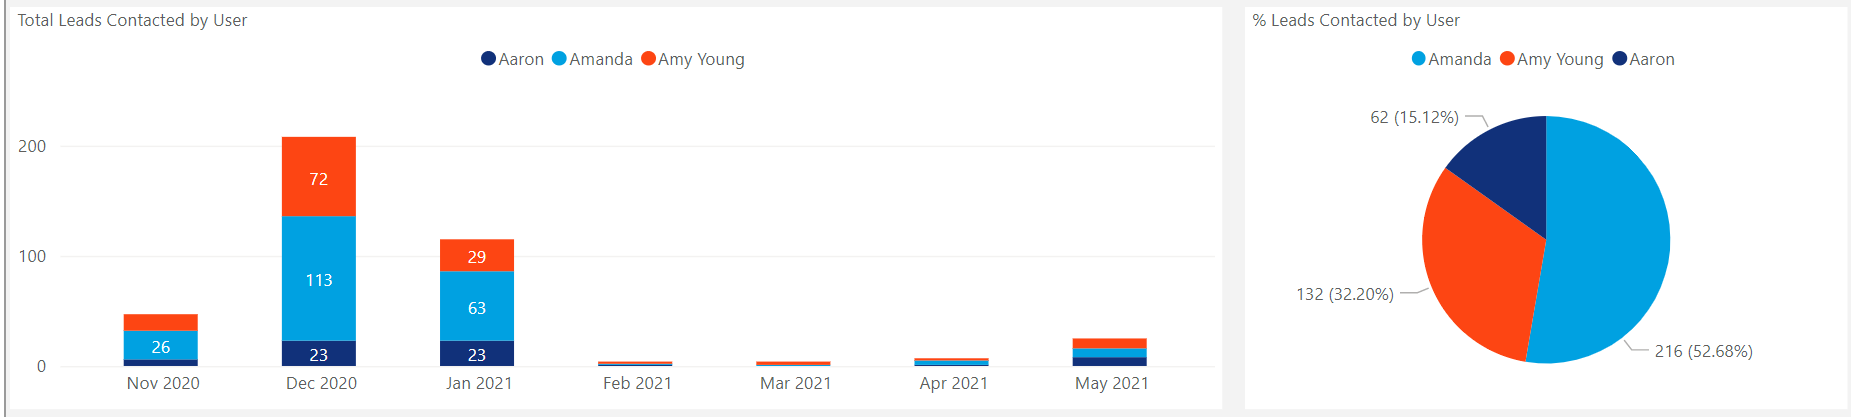
The next module allows you to see how many leads each of your contact management users has sent a message to each month. Each month is represented by a bar, and within the bar are colored sections that represent each contact management user. Here you're able to determine the total number of leads contacted and for which portion of that total each team member is responsible.
Similarly, the pie chart to the right allows you to see for what portion of the total leads contacted within the time frame of the report each team member is responsible.
Outbound Messages
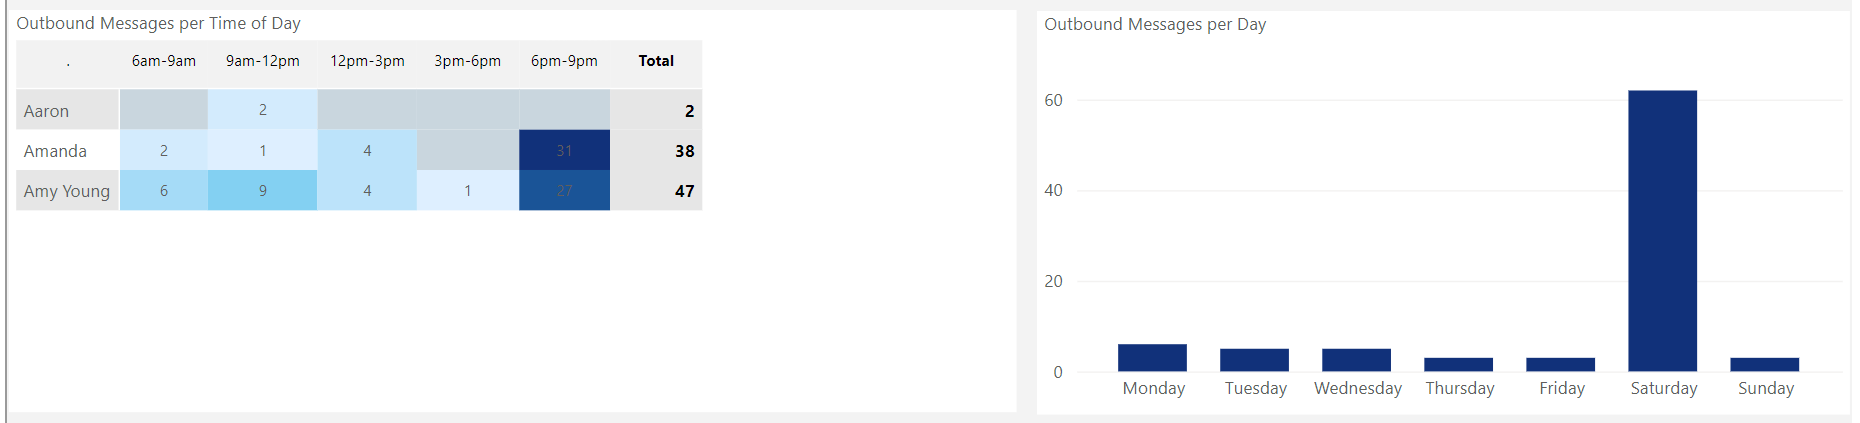
In the next row of the report users will find data relating to outbound messages. These are inclusive of emails sent (either manually or automatically), and text messages sent by each contact management user. In the table on the left is data that represents each contact management user and the times of day they send their messages. The darker the blue color, the higher the volume of outbound messages sent during that timeframe.
The table on the right displays the volume of messages broken out by day of the week.
Inbound Messages
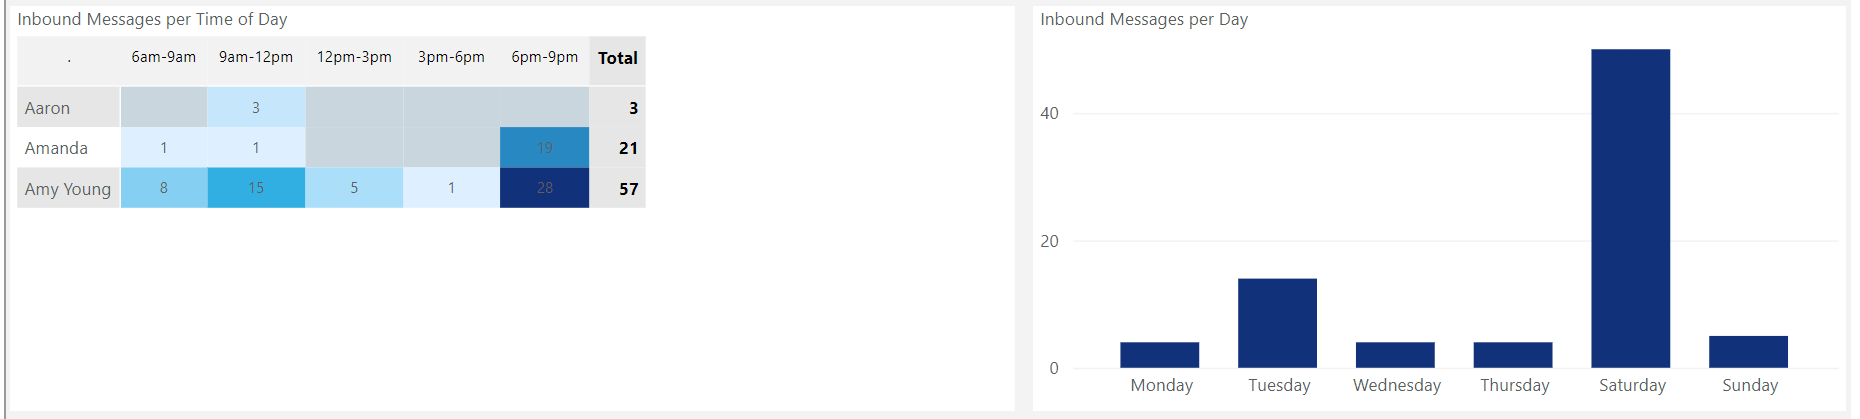
The following row displays similar information but for inbound messages. Here you'll find data relating to the responses each contact management user receives to their outbound messages. On the left is a table noting the inbound messages sent to contact management users. Like above, the data is displayed to show which times of day get the highest volume of responses.
The table to the right displays data that illustrates the inbound message volumes for each day of the week.
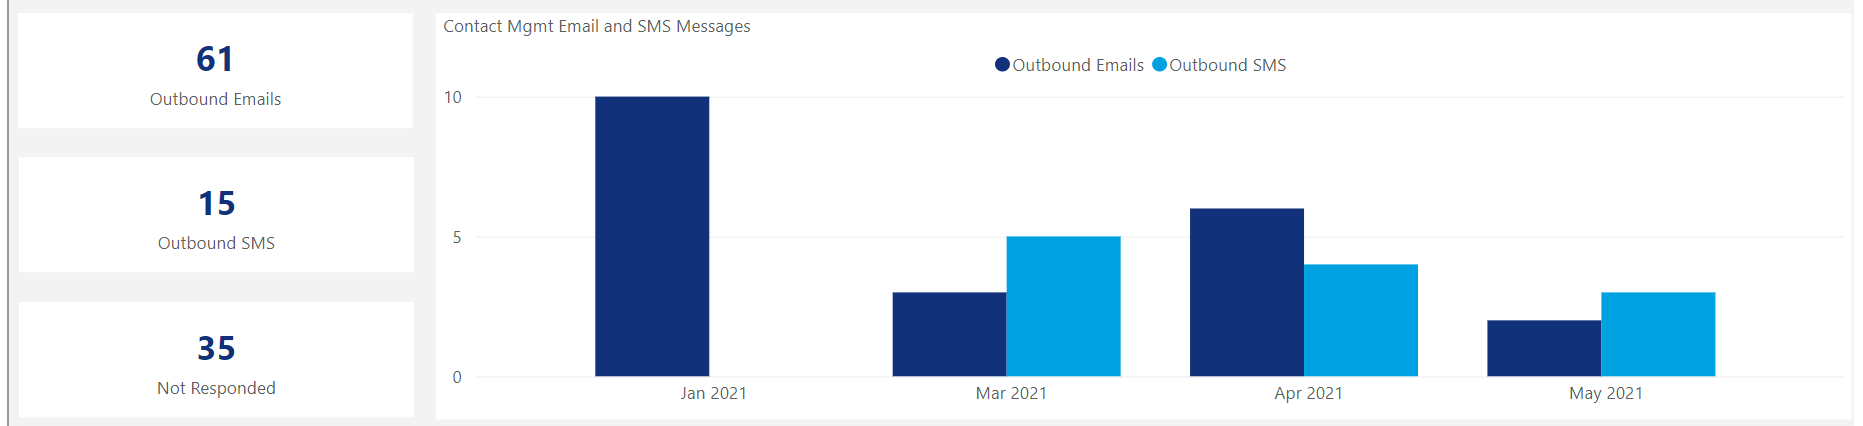
Message Type Metrics
In the next row users can locate messages counts differentiated by the contact method. On the left you'll find a count of total outbound messages split between emails sent and text messages sent. The last module on the left displays the number of prospects which have not been responded to by the contact management users.
In the table to the right you can see how many of each outbound message type have been sent each month.
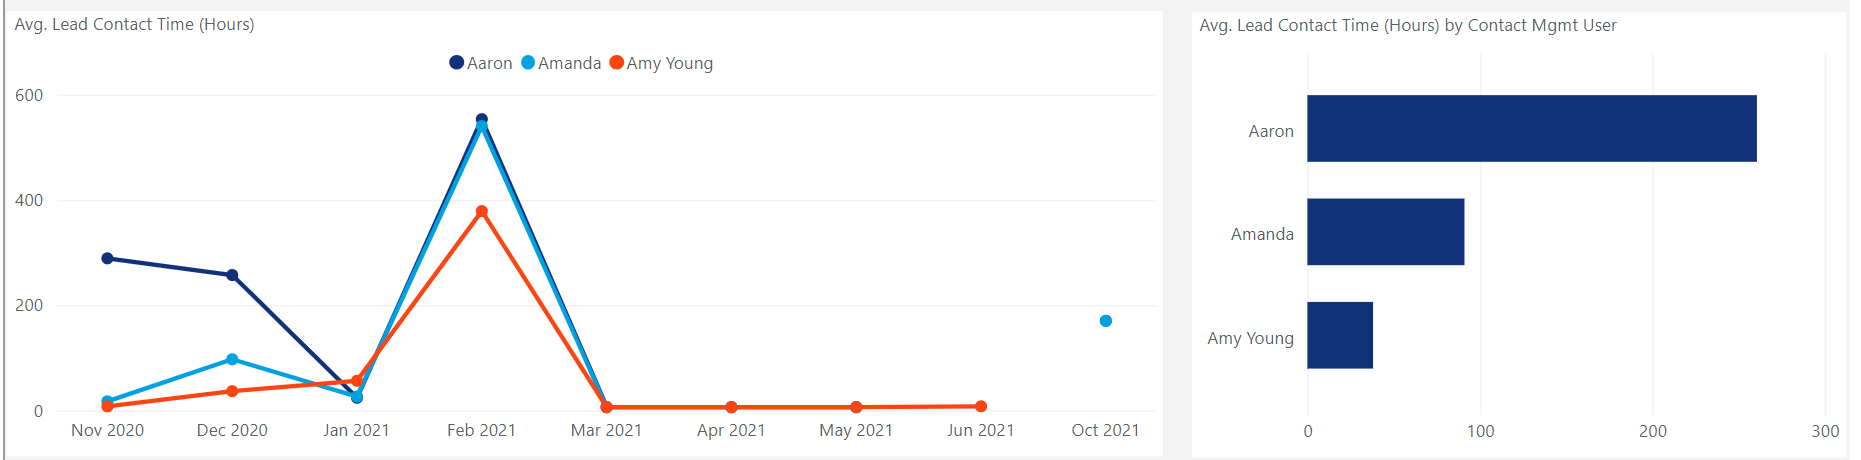
Average Lead Contact Time
The first chart in the Average Lead Contact Time row users will find trends that represent the average response time (in hours) for each contact management user. This allows you to see on average each month how quickly each contact management user is responding to his/her leads.
The second graph in the row displays the overall average response time for each contact management user.
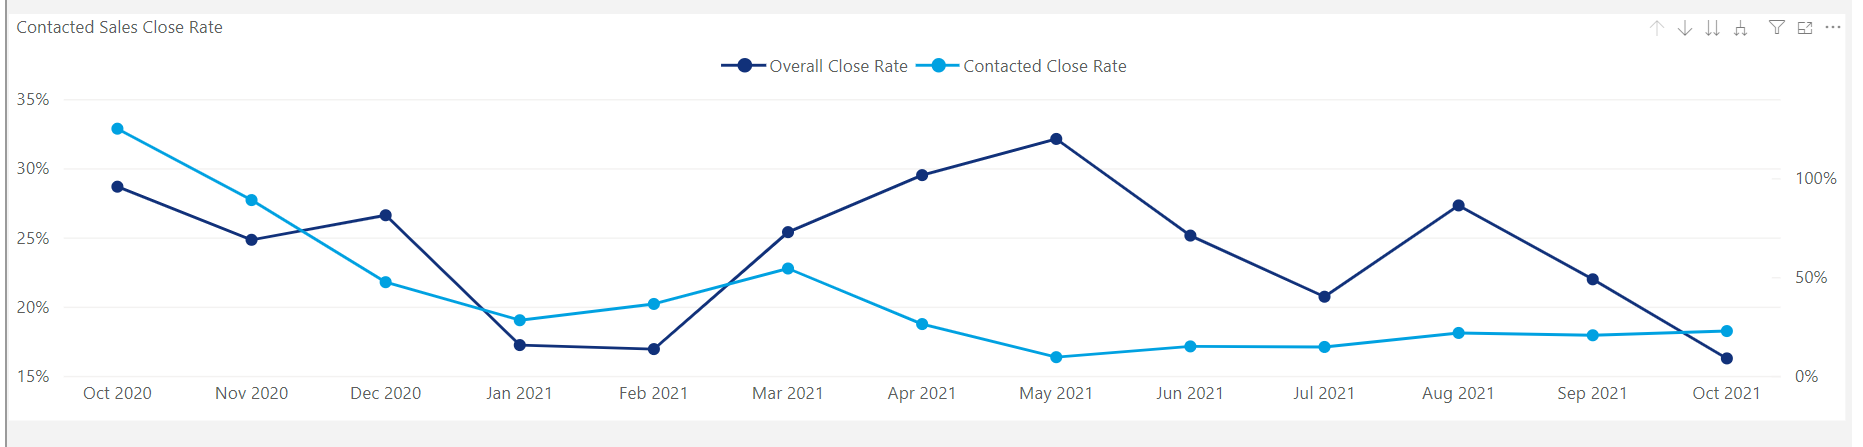
Contacted Sales Close Rate
The last row of the report displays a comparison of the overall close rate for your prospects to the close rate of prospects who were contacted by your team. This allows you to determine the effectiveness of the communications contact managers are having and to measure the added value of their efforts.
1. What is contact management?
Contact management is the process of storing, organizing, tracking, and maintaining information about individuals or organizations you interact with—such as customers, leads, partners, or stakeholders.
2. Why is it important to measure contact management efforts?
Measuring contact management helps you:
- Evaluate how effectively you manage relationships
- Identify gaps or inefficiencies in outreach
- Improve communication strategies
- Increase conversion rates and retention
- Ensure data quality and consistency
3. What are key metrics used to measure contact management?
Common metrics include:
- Contact growth rate – how quickly your contact list is expanding
- Engagement rate – how often contacts interact (emails, calls, etc.)
- Response time – how quickly you follow up
- Conversion rate – percentage of contacts that become customers or take desired actions
- Data completeness – how much useful information each contact record contains
4. How do you measure engagement with contacts?
Engagement can be measured by:
- Email open and click-through rates
- Call frequency and outcomes
- Meeting attendance
- Replies to communications
- Activity logs in CRM systems
5. What tools are commonly used for contact management measurement?
Typical tools include:
- CRM systems (e.g., Salesforce, HubSpot, Microsoft Dynamics)
- Email tracking tools
- Analytics dashboards
- Customer data platforms (CDPs)
These tools often provide built-in reporting features.
6. How can data quality impact measurement?
Poor data quality can lead to:
- Incorrect insights
- Missed opportunities
- Duplicate or outdated contacts
- Ineffective communication
Maintaining clean, accurate, and updated data is critical for meaningful measurement.
7. What is a good way to track contact activity?
Best practices include:
- Logging all interactions (calls, emails, meetings)
- Using automated tracking whenever possible
- Standardizing how activities are recorded
- Reviewing activity reports regularly
8. How often should contact management performance be reviewed?
It depends on your goals, but common intervals are:
- Weekly (for activity tracking)
- Monthly (for performance trends)
- Quarterly (for strategic evaluation)
9. How can contact segmentation improve measurement?
Segmenting contacts (e.g., by industry, behavior, or lifecycle stage) allows you to:
- Compare performance across groups
- Tailor communication strategies
- Identify high-value segments
- Improve targeting and efficiency
10. What are common challenges in measuring contact management?
Challenges include:
- Incomplete or inconsistent data
- Lack of standardized processes
- Limited visibility into interactions
- Over-reliance on manual tracking
- Difficulty linking activities to outcomes
11. How do you improve contact management performance?
You can improve by:
- Setting clear goals and KPIs
- Using automation tools
- Training teams on proper data entry and usage
- Regularly auditing data quality
- Analyzing performance and making adjustments
12. What does success look like in contact management?
Success typically includes:
- High-quality, accurate contact data
- Strong engagement rates
- Timely and consistent follow-ups
- Improved conversion and retention rates
- Efficient and scalable processes