 The email performance report has some similarities to the email sends report, but it offers the ability to gain additional insights into the successes of certain marketing tactics. Within this report, you'll find data relating to the volume of email sends for a given period, the open and click metrics of each type of email, and (most importantly) the lead conversion of each.
By utilizing this report, you'll be able to make such statements as "our Zyker model launch announcement email had a 35% open rate, 12% click-through rate, and a 3% lead conversion rate." Once you are able to capture data to this level of granularity, it also becomes possible as you convert those leads to sales that you can make conclusions about ROI for each email send.
When analyzing the data in your reports, it will be important to understand how the metrics are calculated. Below are some statements about the data in this report, as well as how they relate to other data points you might find within Aimbase.
Lead conversion as it is measured in this report is not based upon data driven by tracking URLs you might have used within your emails. Instead, lead conversion is defined by a prospect who has entered a lead and received and opened/clicked an email within 90 days prior to the lead entry date. If multiple emails were sent to the prospect within that 90-day window, then the credit for the lead is evenly distributed across all emails that the prospect interacted with.
The difference in looking at this data based upon tracking URL usage vs. the method in the report is that capturing the data based on tracking URLs will tell you how many leads were entered more immediately upon receipt of the email. The report allows you to see how many leads were entered by people after engaging with the email who may not have acted upon it immediately.
Watch the Summary Tab Video
What information does the Summary tab provide?
Beginning on the Summary tab, there are a series of filters that allow you to scale back the data you're reviewing in a more targeted manner. The most important filter to start with is the date filter. Setting the date range will determine the data displayed in the report. This filter will parse the data down based on the send date of the email.
When you initially load the report, you'll notice that there is a filter set on the Email Type. The Email Types that are chosen by default are used for Lead Autoresponders, Lead Nurtures, and Campaign emails. In short, the report is setup to show you data relating to, primarily, consumer-facing email by default. You can view data for all Email Type by clicking on the down arrow for that dropdown and selecting all other values. Any filter you set will impact data on all tabs of the report.
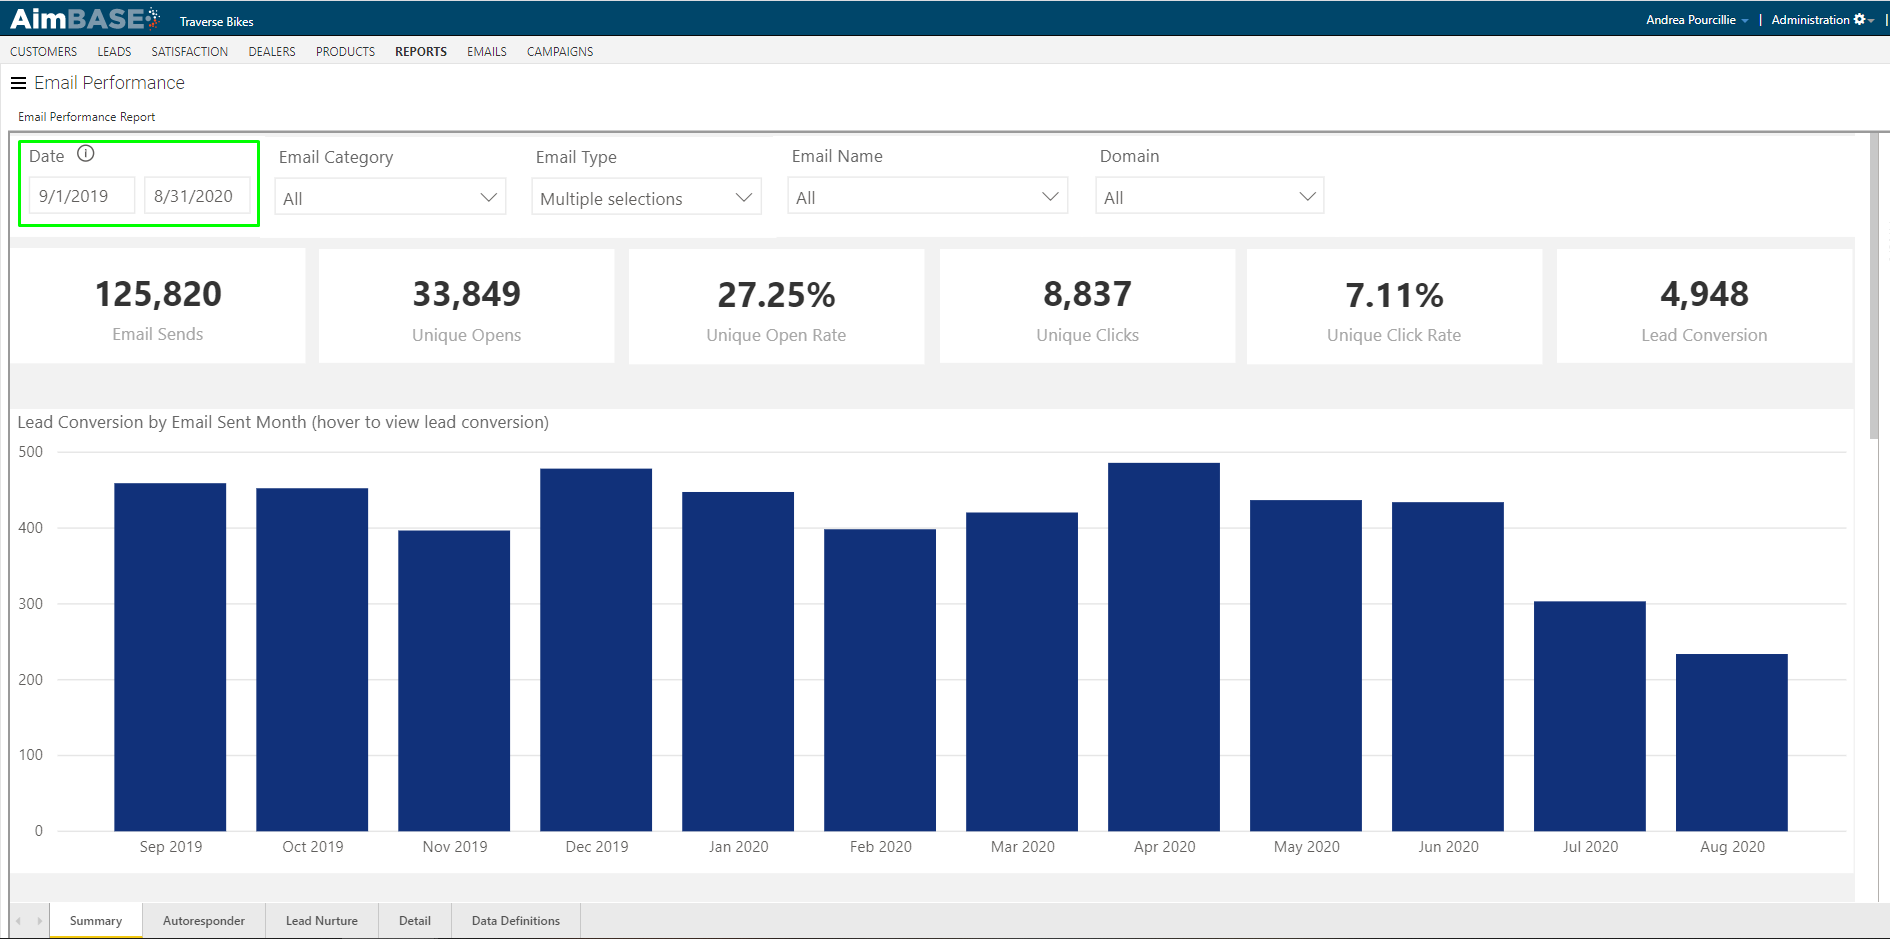
What KPIs does the report show?
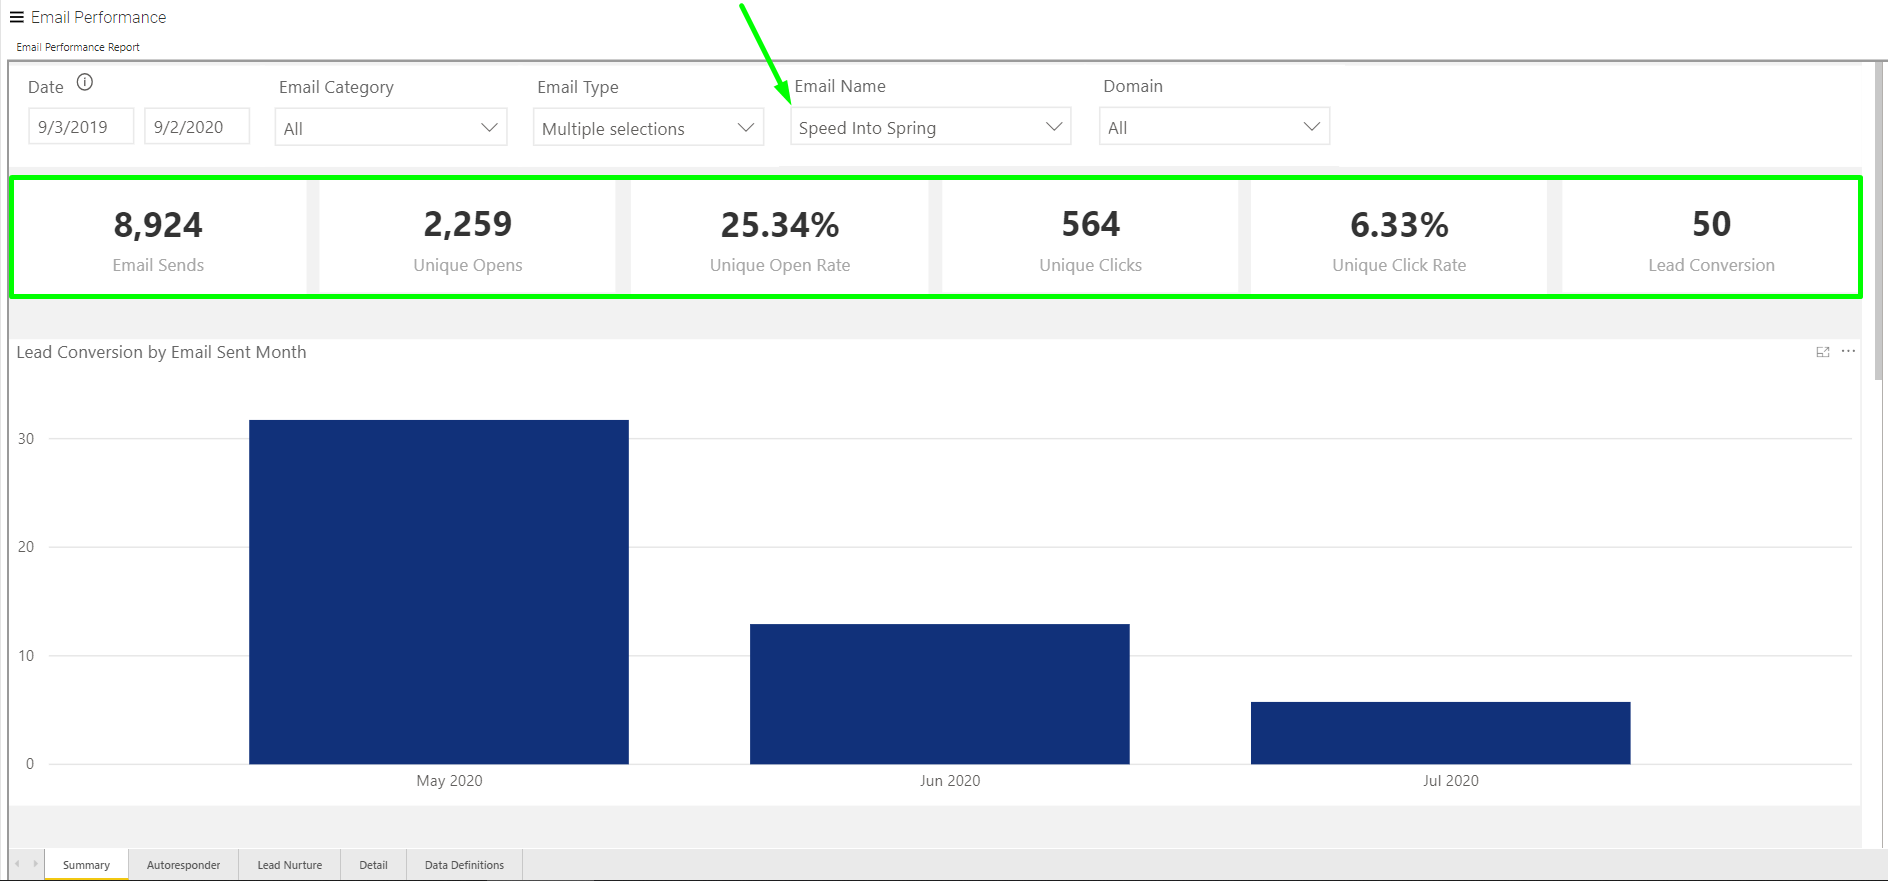
The KPIs in this report allow you to see the volume of emails sent, unique opens, unique clicks, their corresponding rates and the volume of leads generated by the email sends. By default, the report will show data for all emails (of the filtered types) for the time frame. By utilizing the Email Name filter, you can scale back the data displayed to be specific to an individual email.
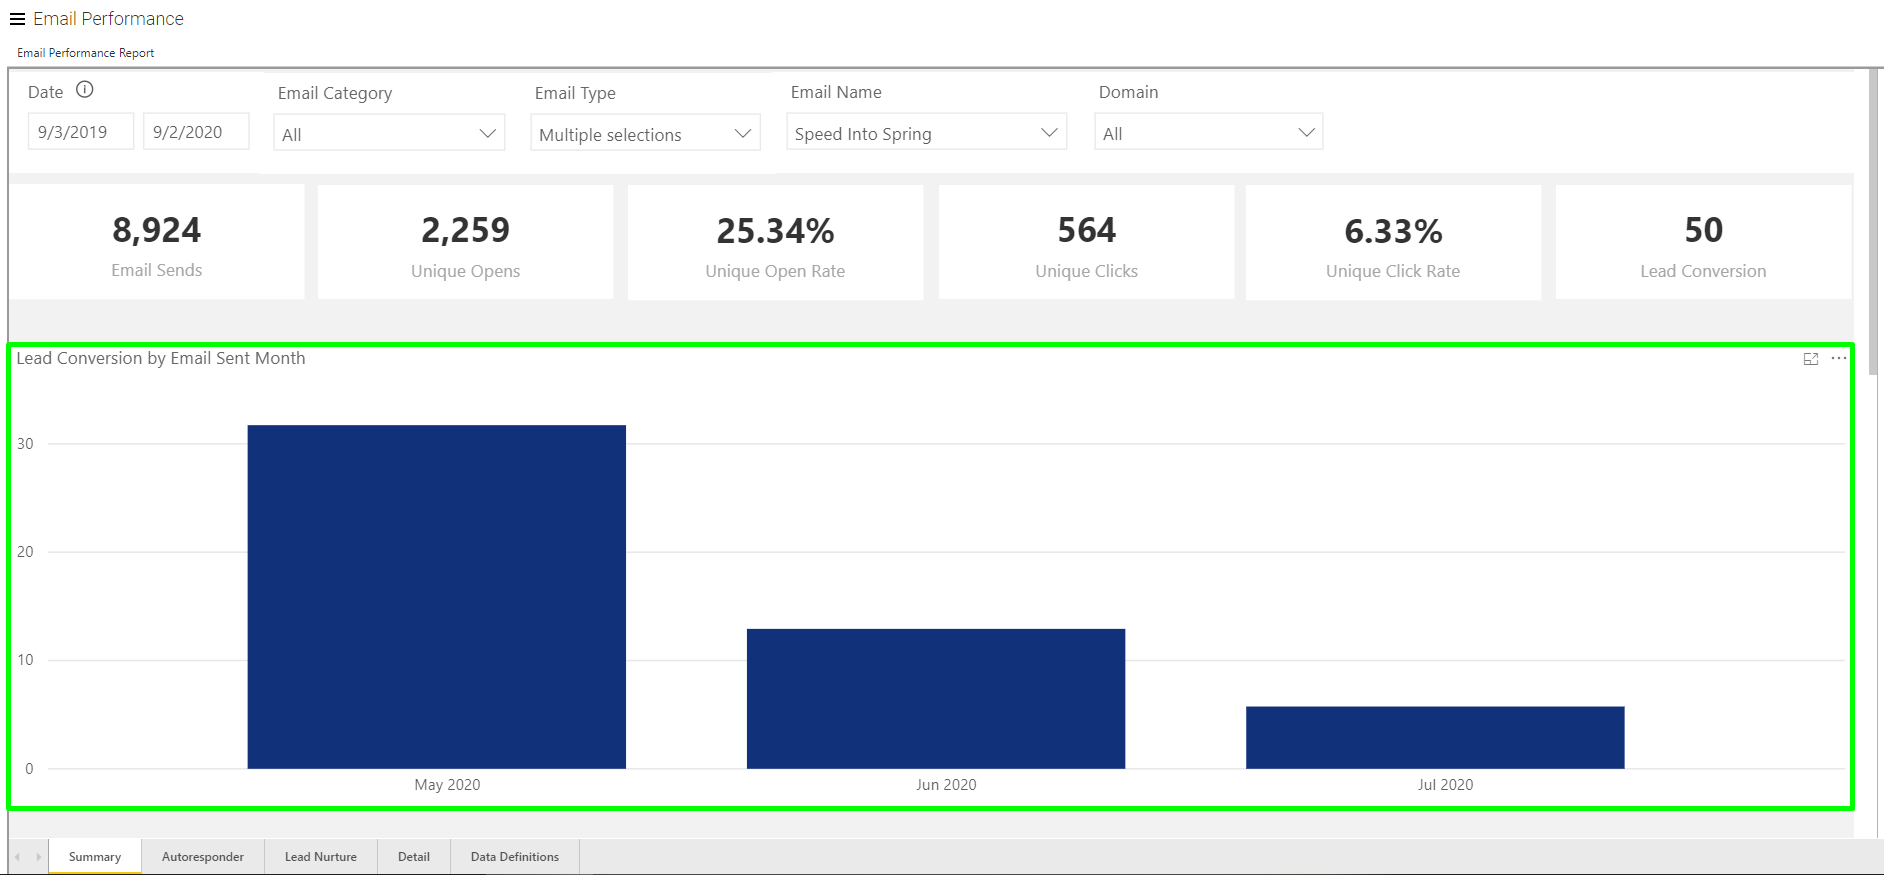
What does the Lead Conversion by Email Sent chart show?
This chart will allow you to see month-by-month what your lead conversion volume has been for the emails sent within each month. What's interesting about this view is that it allows you to see both the information based on the date the email (which generated the lead) was sent, as well as the months following the email send in which leads were entered.
For example, in the screenshots below (as with the one above) you will see data for a single email (not email send, but email) this means that this data is reflective of all instances of this email being sent. For a campaign email, most of the time this will be a single send, but it is possible to send the same email multiple times. You may do this, for example, if you are trying to target different lists and embed unique tracking parameters per list.
What this initial view is illustrating is that within the month of June 2019, emails sent resulted in 13 leads.
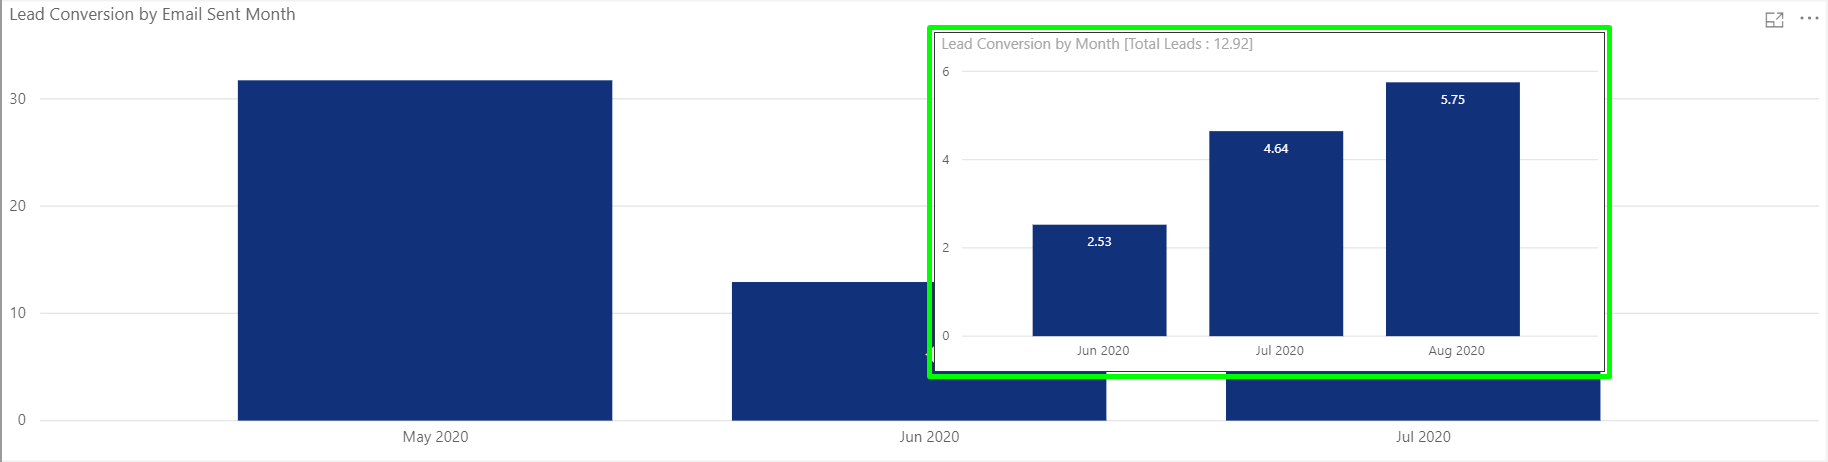
By hovering over each month/bar, you'll see additional details about the timing for which the leads were entered. In the example below, you'll see that the 13 leads that were entered as a result of an email sent in June, were entered throughout June, July, and August.
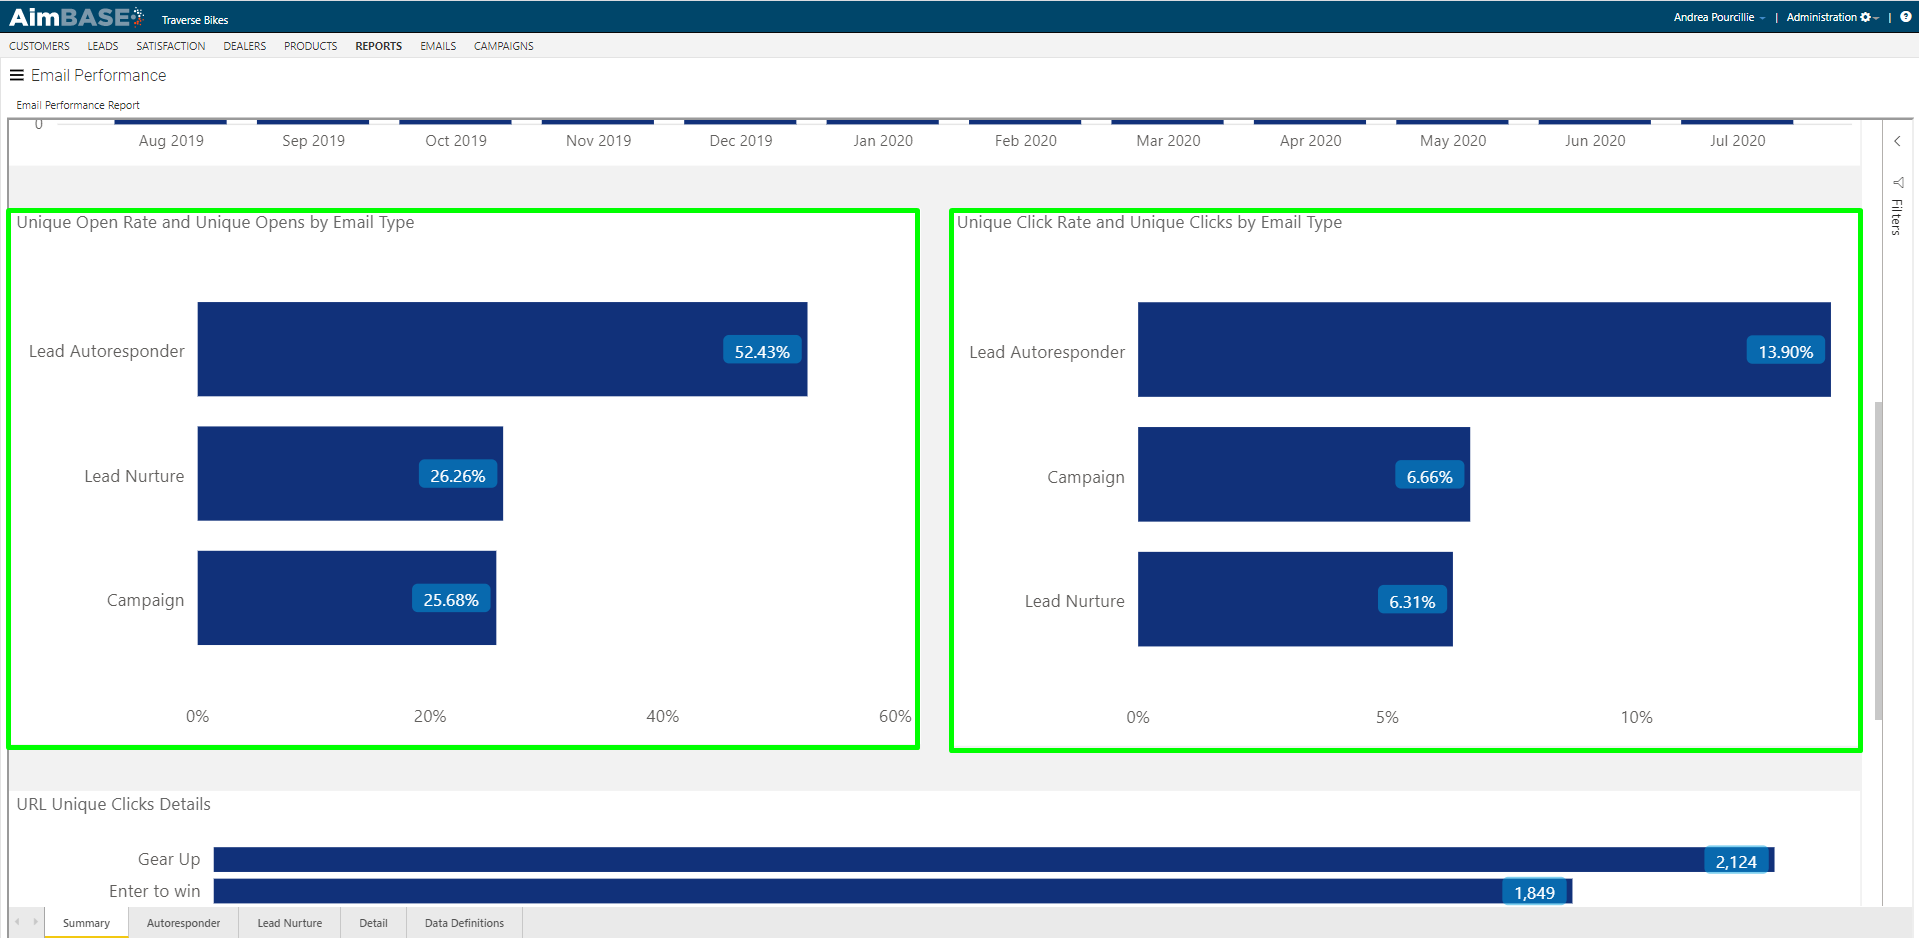
What do the Unique Opens/Open Rate and Unique Clicks/Click Rate charts show?
On these charts, you'll be able to see by email type what the open rates and click-through rates are for each email type. By hovering over each bar you'll see the actual number of unique opens/clicks respective to the charts below for each email type.
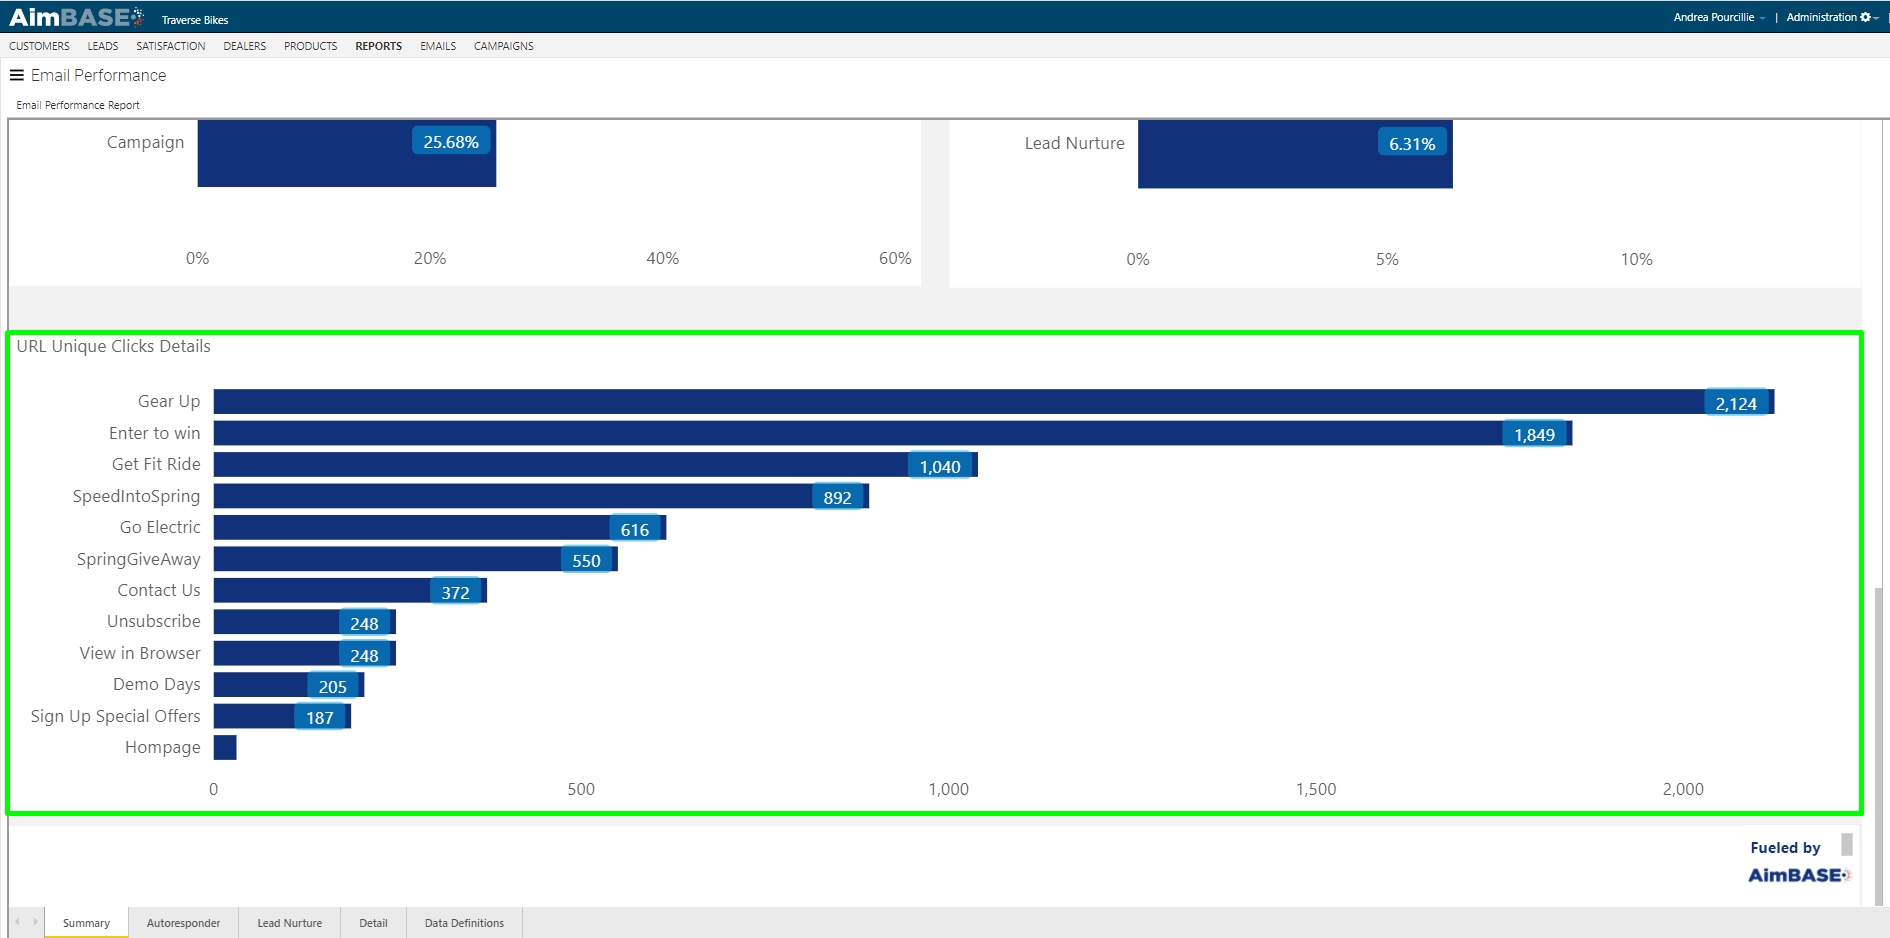
What does the URL Unique Clicks Details table display?
In the table below is displayed the unique click count for each URL title present within the emails. URL titles are not always specific to a single email as they may be used within multiple emails to identify the same link. What you're seeing below gives you some idea of which links within your emails produce the most engagement or interaction.
Watch the Autoresponder & Lead Nurture Tab Video
What information is shown in the Autoresponder and Lead Nurture tabs?
Within the Autoresponder tab is data specific to the email type. Here you'll find open and click metrics related to the emails your prospects receive immediately after lead entry.
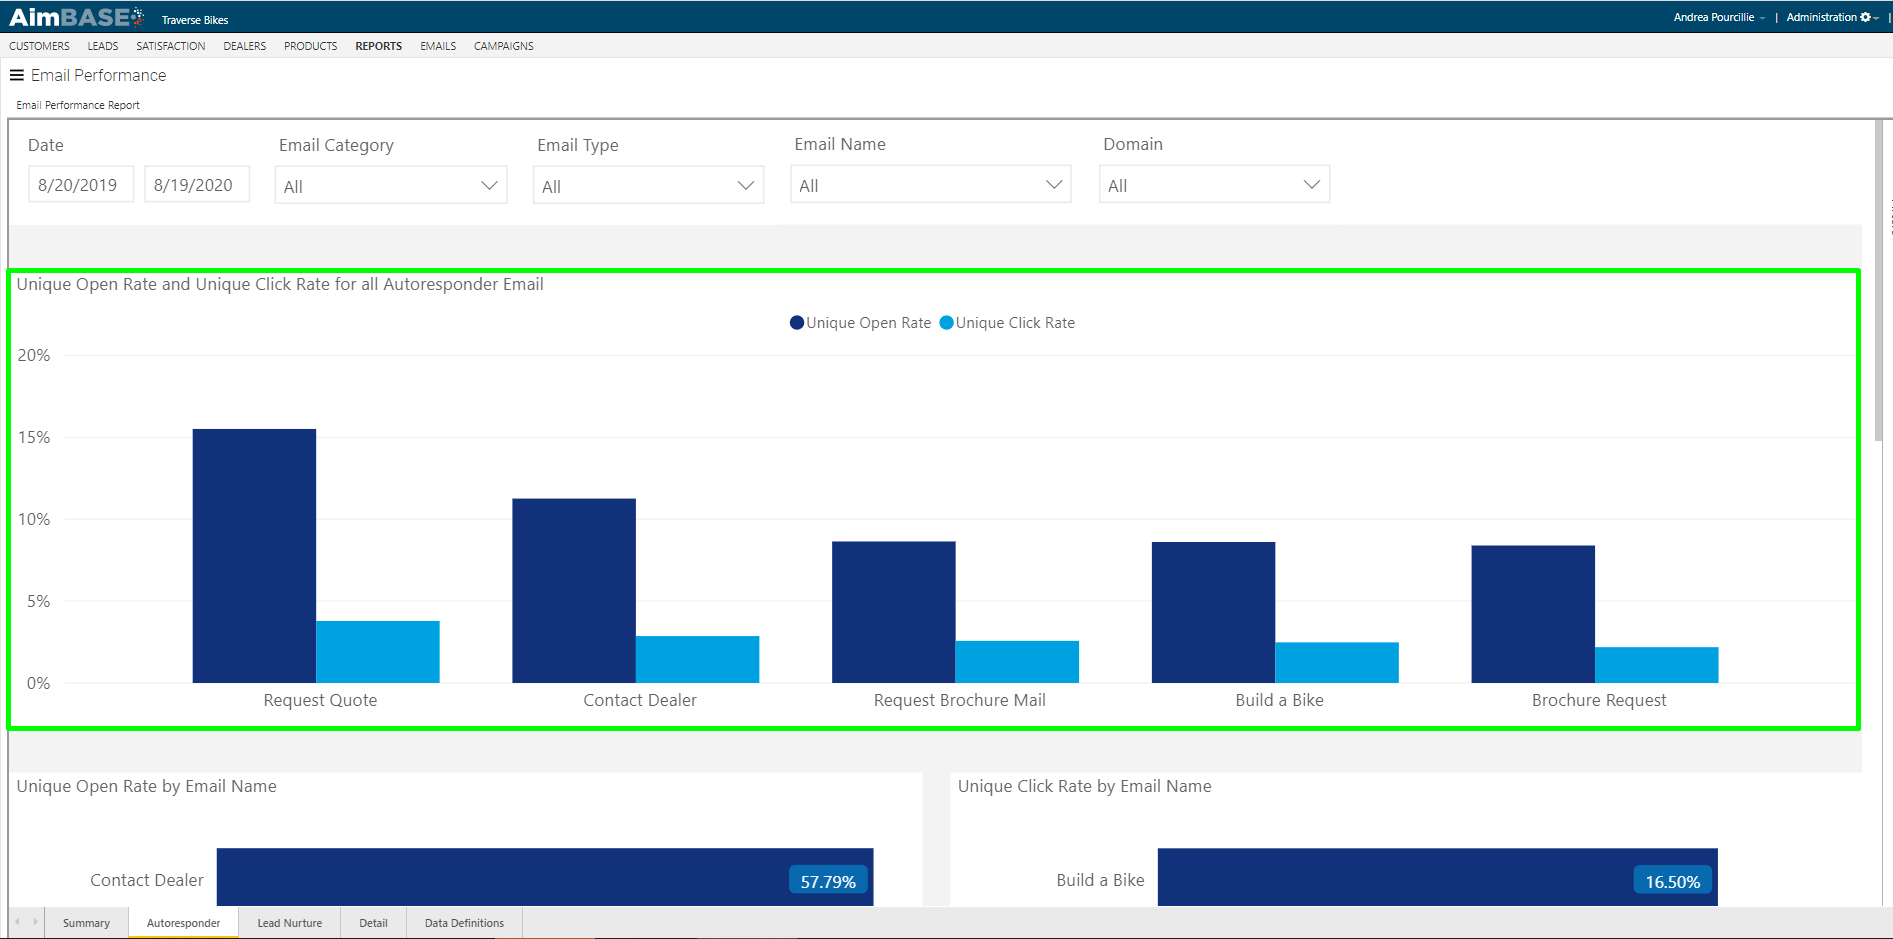
What does the Unique Open/Click Rate for Autoresponder Emails chart show?
On this graph, each set of bars represents an autoresponder. This view may have more or fewer bars depending upon the number of autoresponders you use within your version of Aimbase. For each autoresponder, you'll see the unique open rate as well as the unique click rate. It is important to note that percentages on this view are based on how the unique opens and clicks relate to the total number of autoresponders sent. Example: Within the time frame, 11,003 autoresponders were delivered to a combination of the autoresponders in use. Of those delivered, 978 unique opens occurred on the Request Brochure autoresponder. 978/11,003 = 8.89% open rate.
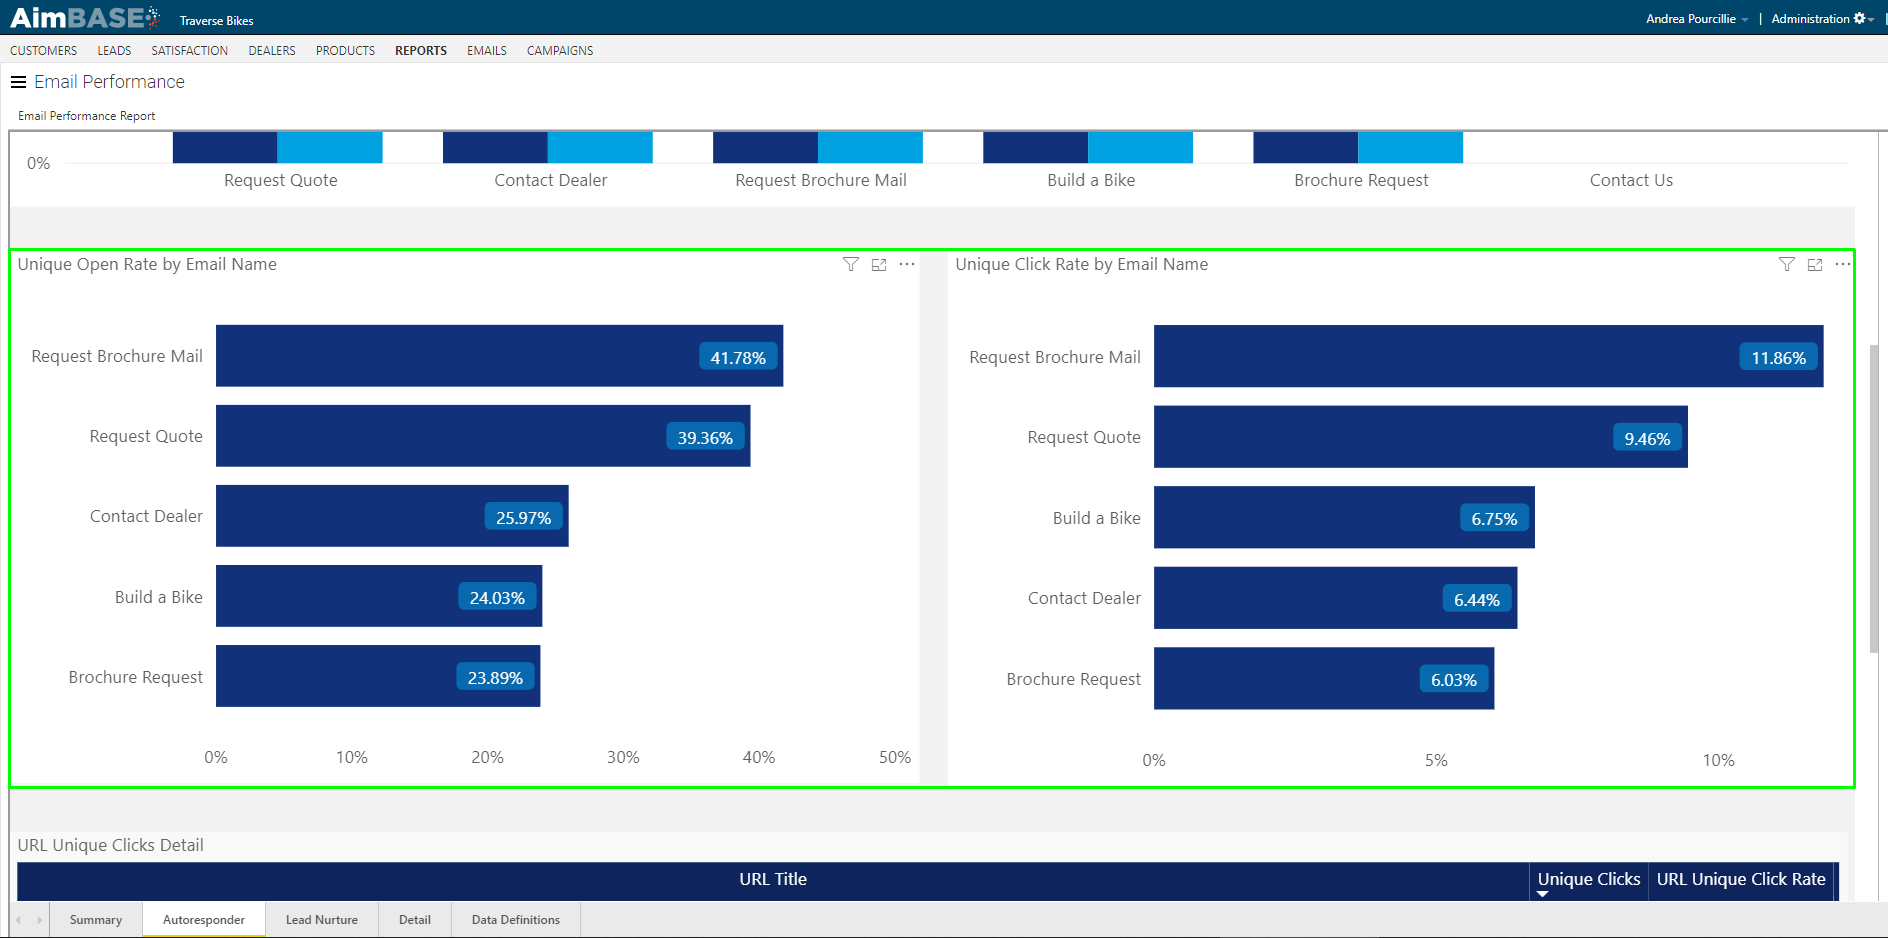
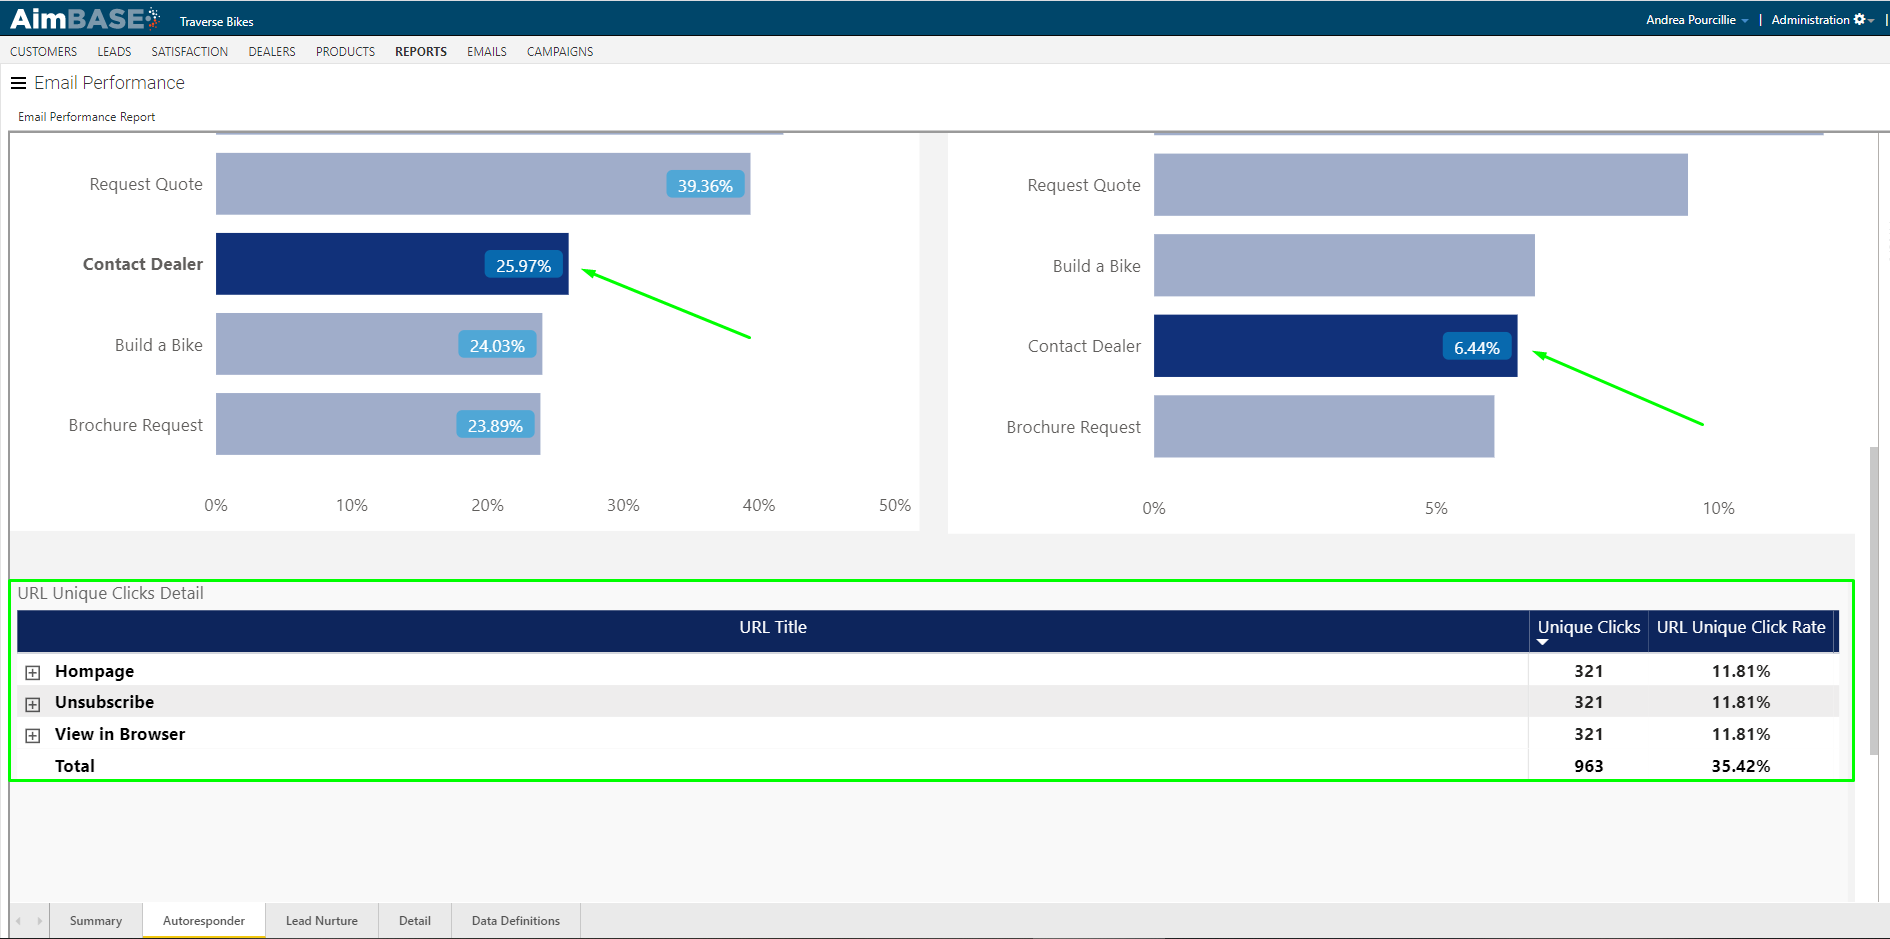
What does the Unique Open/Click Rate by Email Name chart show?
The next set of charts display similar types of metrics, but these are specific to the email and not dependent on the whole. For example, according to the data below, the Request Brochure email is opened 23.89% of the time and clicked-through 6.03% of the time.
What does the URL Unique Clicks Detail table show?
The final table on the tab displays data once you click on a bar from either the Unique Open Rate or Unique Click Rate charts. The data displayed represents the links that were clicked within the email selected. This data differs from the data in the Unique Click Rate chart because the Unique Click Rate reports a single click within the email. The data in the Detail table tells you unique clicks for the specific links within the email.
Watch the Details Tab Video
What does the Details tab provide?
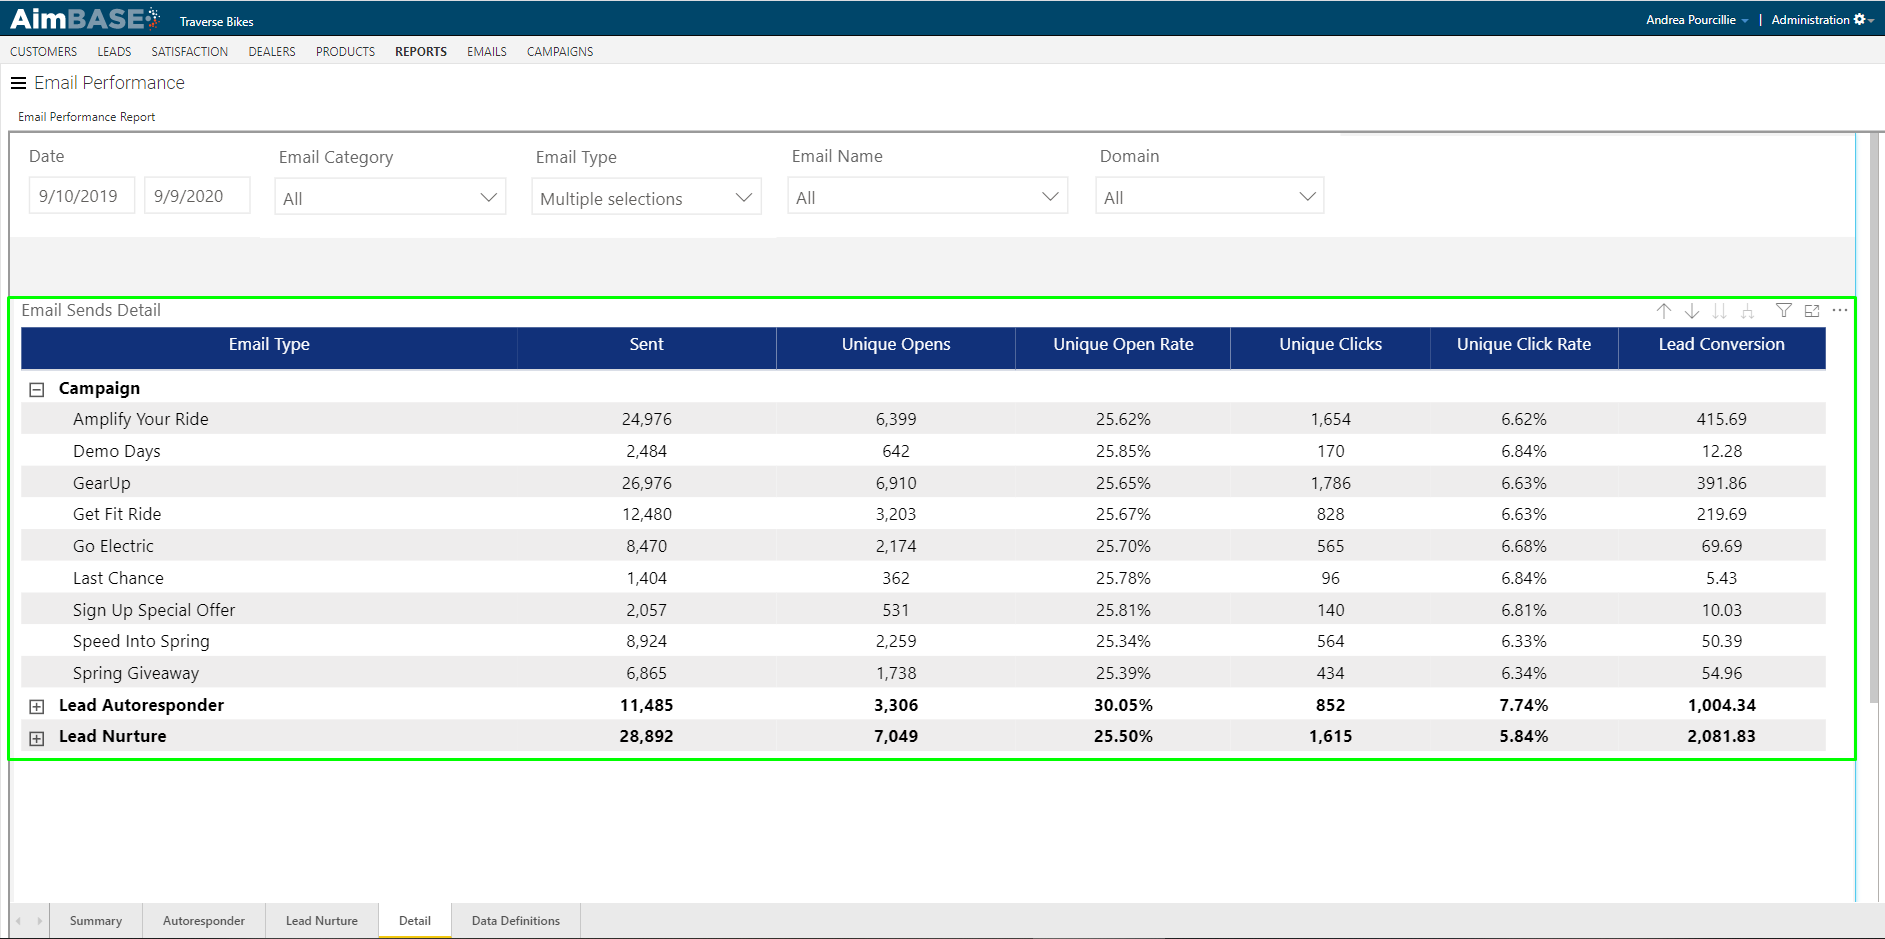
The Details tab provides an overall look at the key metrics of each email type, and it allows you to drill into each section to see those same metrics for each email sent within the respective email type. In the example below, the bold row refers to email types, and the items nested below them are the names of the emails sent. The last column within the view indicates how many leads each email type/email name is being credited for. Remember, for the purposes of this report, lead conversion is defined by a prospect who has entered a lead and received an email within 90 days prior to the lead entry date. If multiple emails were sent to the prospect within that 90-day window, then the credit for the lead is evenly distributed across all emails sent.
FAQs
What does the Email Performance Report provide?
It provides data on email send volume, open and click metrics by email type, and the lead conversion associated with those emails.
How does this report differ from the Email Sends Report?
It offers additional insights into the success of marketing tactics and lead conversion that are not provided in the Email Sends Report.
How can this report help evaluate marketing performance?
It allows you to see open rates, click‑through rates, and lead conversion rates for emails, which can help inform performance evaluation and support ROI analysis once leads convert to sales.
How is lead conversion defined in the Email Performance Report?
Lead conversion is defined by a prospect who entered a lead and opened or clicked an email within 90 days prior to the lead entry date.
How is credit assigned when multiple emails were opened or clicked within 90 days?
If multiple emails were sent and interacted with in that 90‑day window, lead credit is evenly distributed across all emails the prospect interacted with.
How does tracking URL–based measurement differ from the report’s conversion method?
Tracking URLs show how many leads were entered immediately after receiving an email, while the report shows leads entered after engaging with an email even if the action was not immediate.
What filters are available on the Summary tab?
Filters allow you to narrow data by date range, email type, email name, and other criteria.
Why is the date filter important on the Summary tab?
The date filter determines which email sends are included in the report based on the send date of the email.
Which email types are selected by default when the report loads?
Lead Autoresponders, Lead Nurtures, and Campaign emails are selected by default.
How do the KPIs help in evaluating email performance?
KPIs show the number of emails sent, unique opens and clicks, their rates, and the volume of leads generated.
How can the Email Name filter be used?
It scales back the report data to show metrics specific to an individual email.
What does the Lead Conversion by Email Sent chart show?
It shows month‑by‑month lead conversion volume based on when emails were sent, including leads entered in subsequent months.
What additional information appears when hovering over bars in the Lead Conversion chart?
Hovering shows details about when the leads associated with that email send were entered.
What do the Unique Opens/Open Rate and Unique Clicks/Click Rate charts show?
They show open rates and click‑through rates by email type, with hover tooltips revealing the count of unique opens and clicks.
What does the URL Unique Clicks Details table display?
It displays unique click counts for each URL title used within emails, showing which links generated the most interaction.
What information is provided on the Autoresponder tab?
It provides open and click metrics for autoresponder emails sent immediately after lead entry.
What does the Unique Open/Click Rate for Autoresponder Emails chart show?
It shows each autoresponder’s unique open rate and unique click rate, calculated against the total number of autoresponders sent.
What does the Unique Open/Click Rate by Email Name chart show?
It shows open and click rates specific to individual emails rather than totals across all autoresponders.
What does the URL Unique Clicks Detail table on the Autoresponder tab show?
It shows unique clicks for specific links within a selected email after clicking a bar in the open or click charts.
What does the Details tab provide?
It provides key metrics for each email type and allows drilling down to metrics for each specific email within those types.
What does the lead credit column on the Details tab represent?
It shows how many leads each email type or email name is being credited for based on the 90‑day interaction rule.