The Closed Sales Distribution Report allows you to measure how your sales are distributed across a variety of attributes within Aimbase. With this report, Aimbase captures the registrations that have matched to leads, and it reports the data according to the origin of the prospect, the dealer who closed the sale, how long after the lead the sale took place, and other key characteristics. With this report, you should be able to answer such questions as:
- What is the average dealer close rate?
- Which products convert the most post-lead entry?
- How many days after the lead are dealers closing the sale?
- Which prospect generation methods have the higher likelihood to close?
Watch the Closed Sales Count Dashboard Video
Closed Sales Count Tab
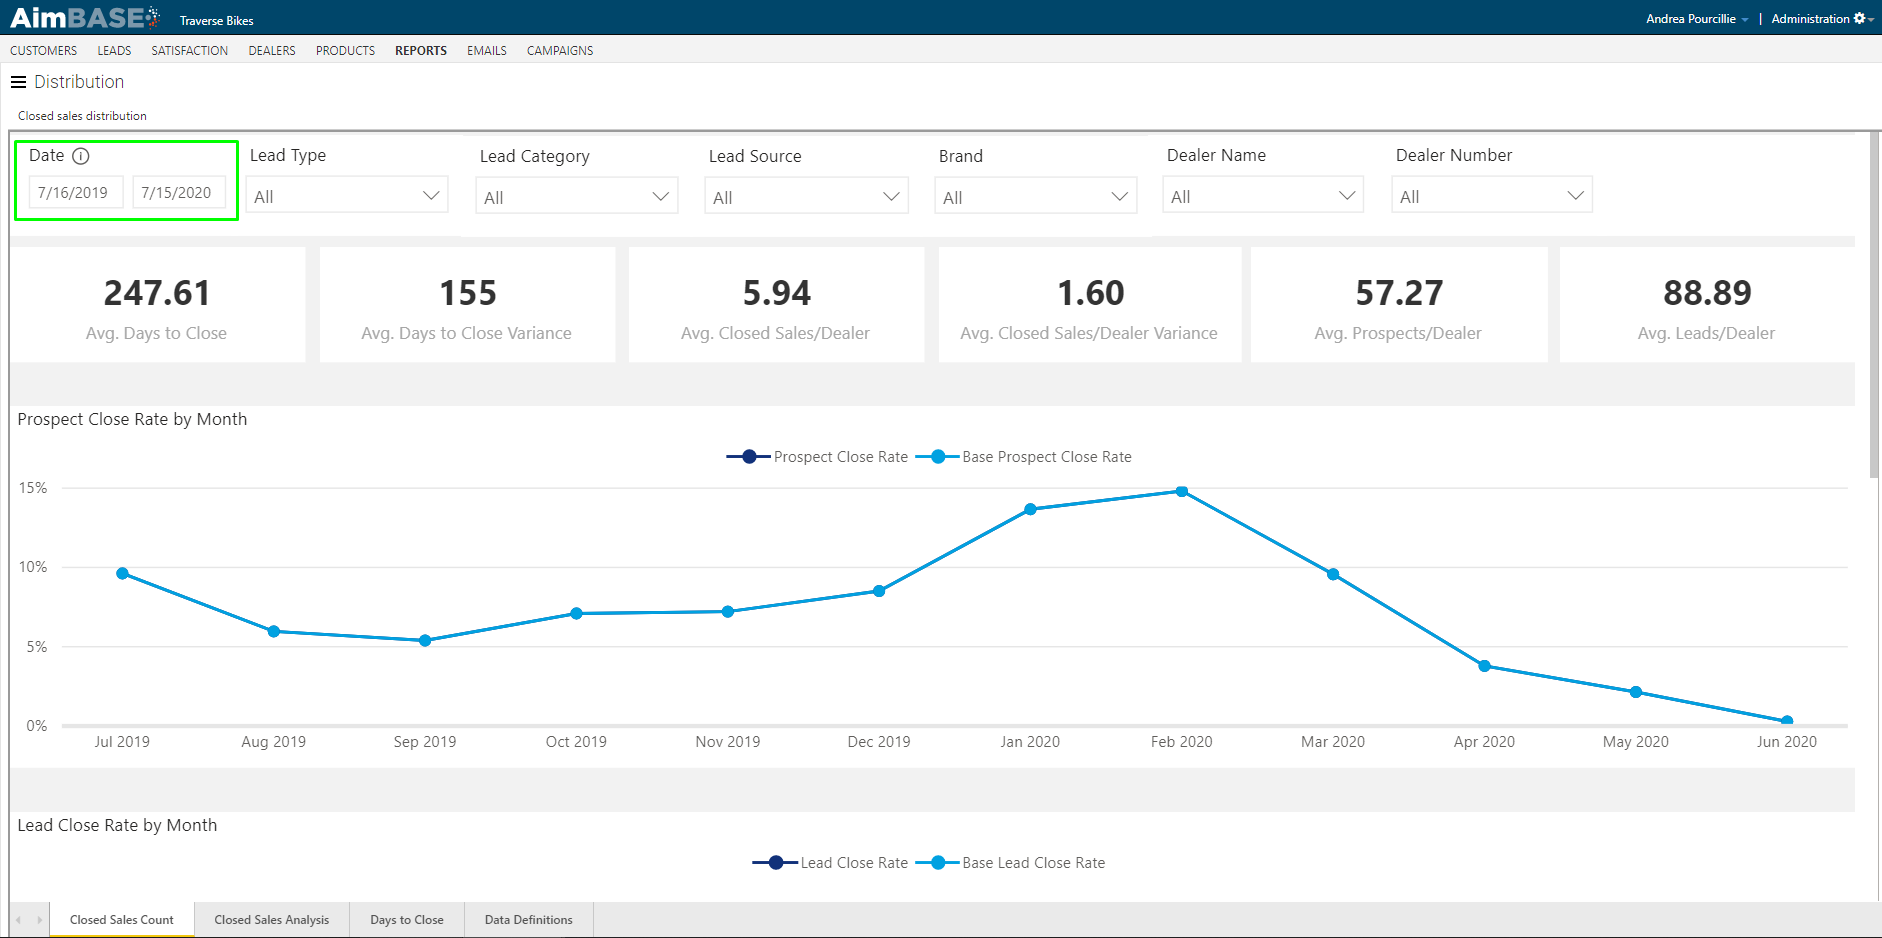
To begin using the report, first select the time frame in the top-left corner.
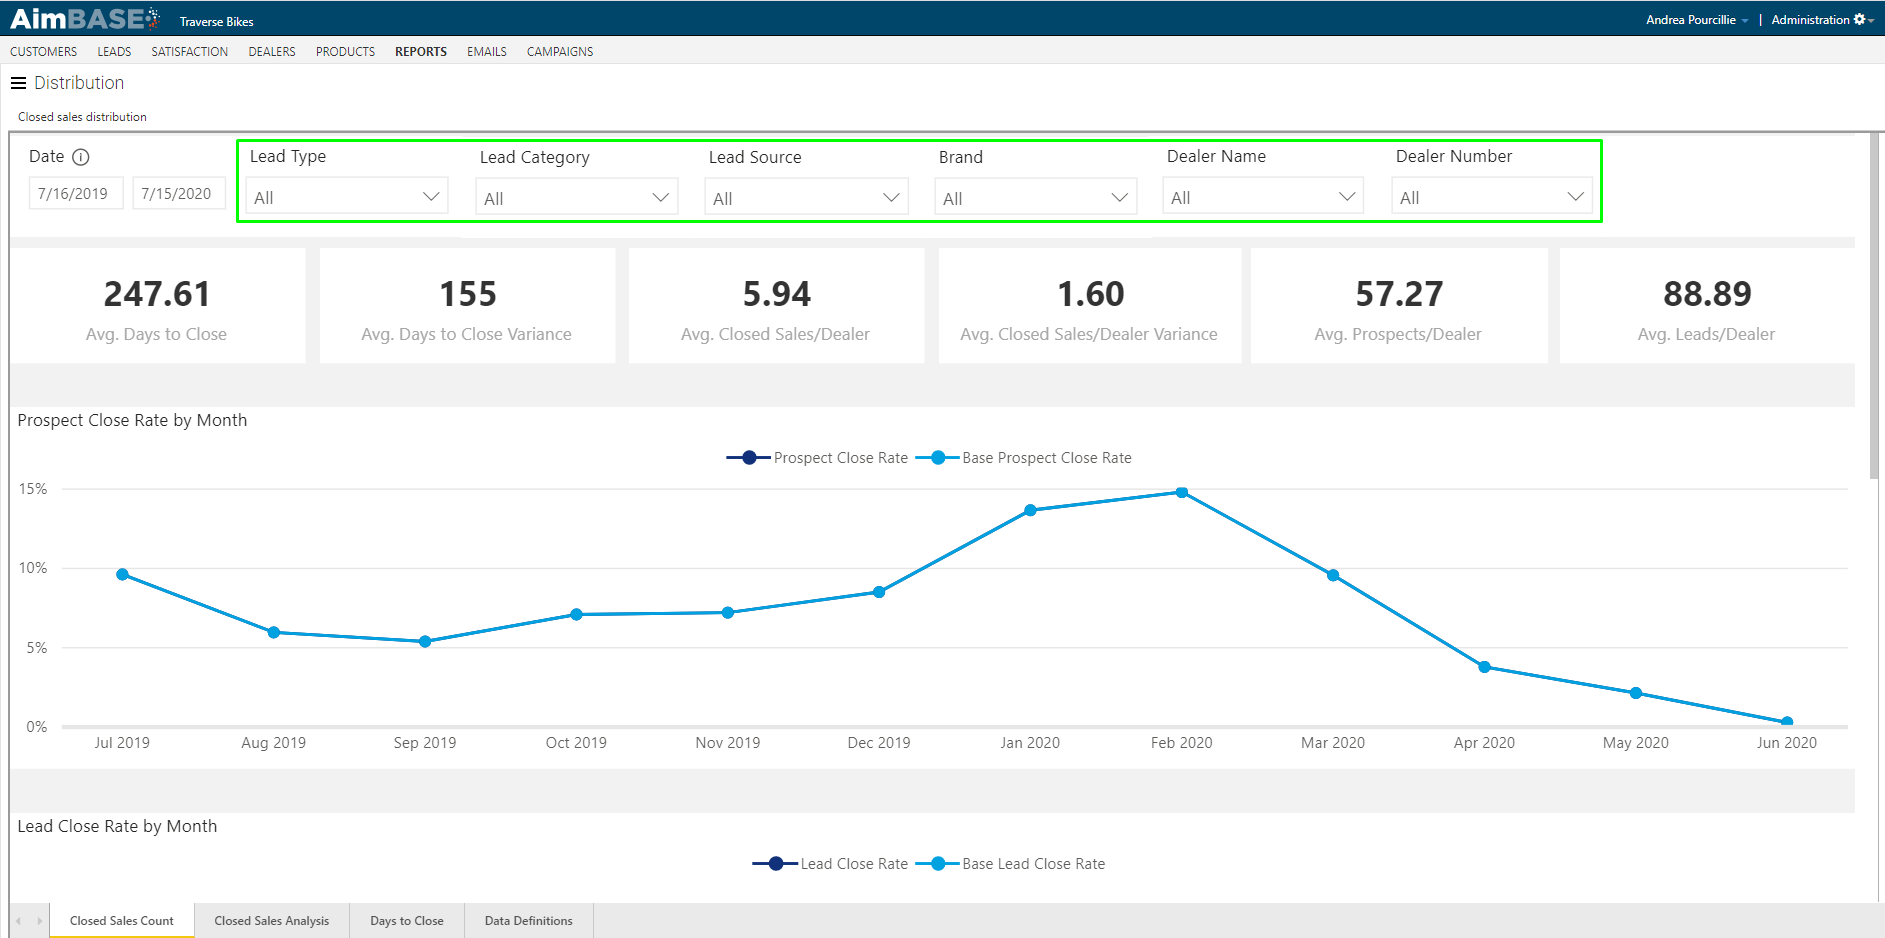
You're also able to filter the data down by lead type, lead category, lead source, brand, dealer name/number, and lead campaign. To utilize the lead campaign filter open the panel on the right of the report to access the filter.
The benefit to utilizing these filters is that if you want to measure how a particular marketing tactic performed, these filters typically will allow you to parse down to the relevant data. For example, if you ran a campaign around a product launch that included paid media and/or email blasts (which also included tracking URLs), by filtering on the campaign you can see how many of those leads converted to sales and from there determine an ROI for the campaign.
Just remember that any date range or filter chosen will impact the data on each tab of the report.
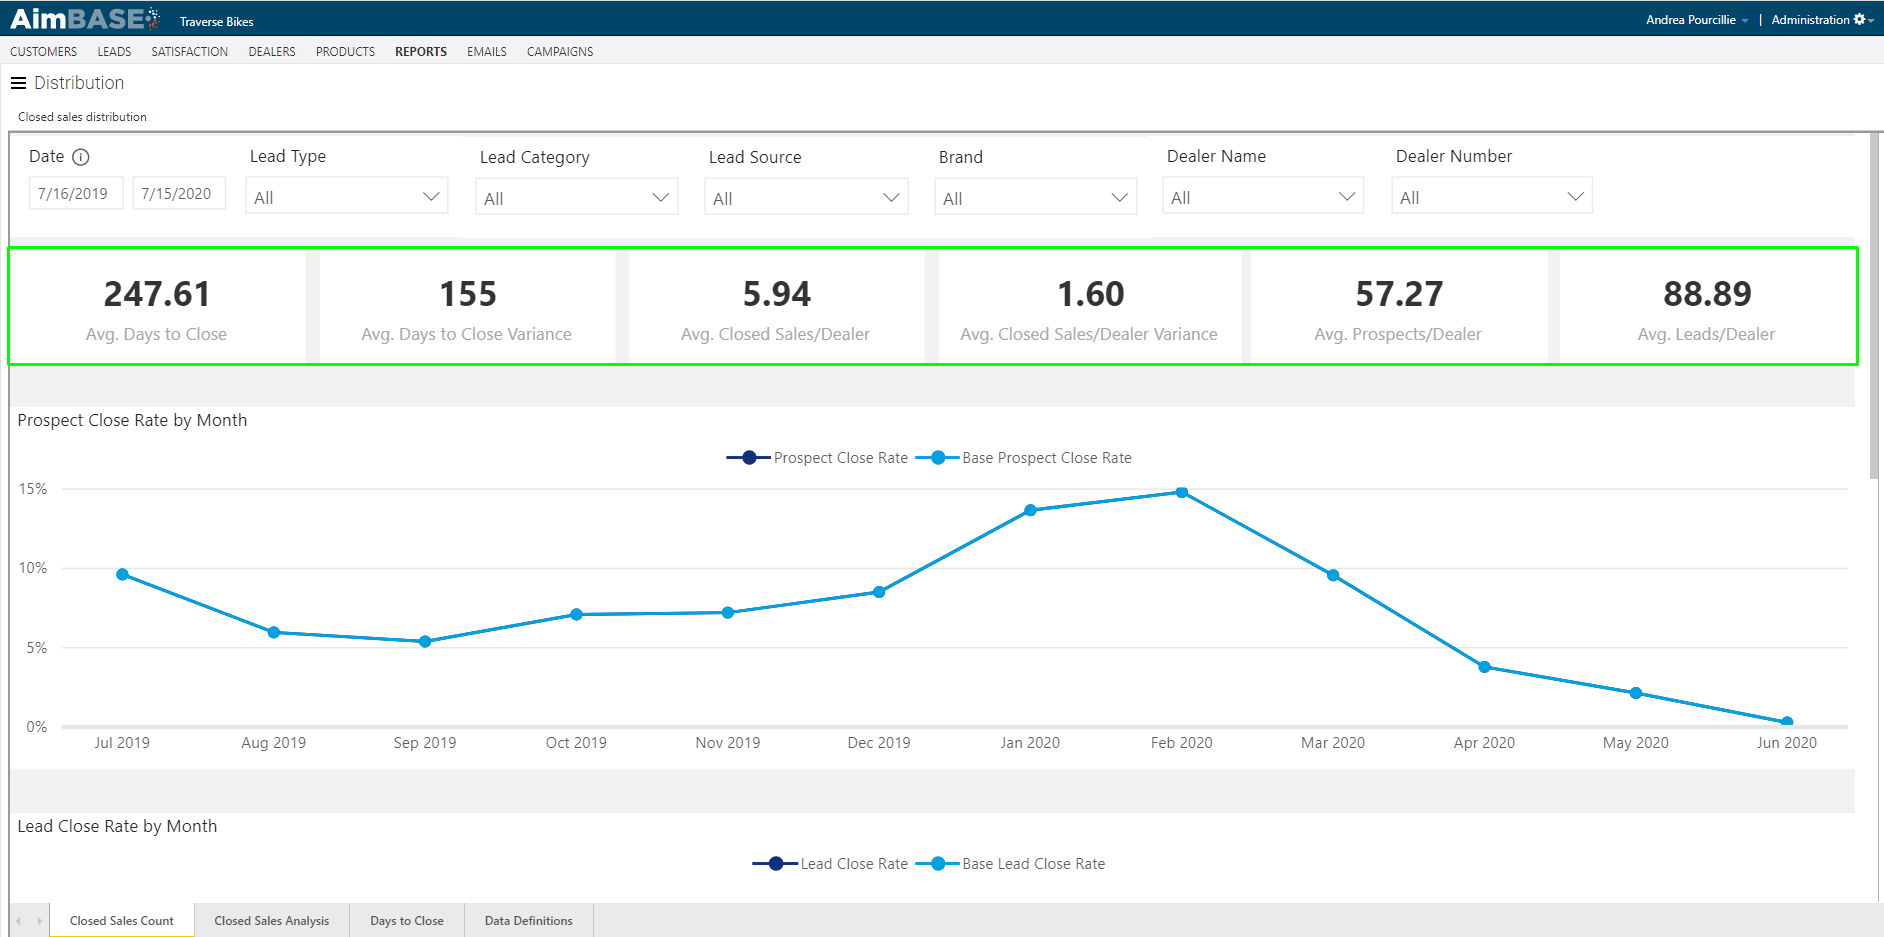
Below the filters are a series of key metrics. In this report the metrics being highlighted are average days to close, the variance in the average days to close for the prior period, prospect close rate variance, average closed sales per dealer, average closed sales by dealer variance, average prospects by dealer and average leads by dealer. The important difference to note here is between average prospects per dealer and average leads per dealer. Remember that a prospect is defined as a person and a lead is an instance of one of those people submitting a form.
Prospect Close Rate by Month
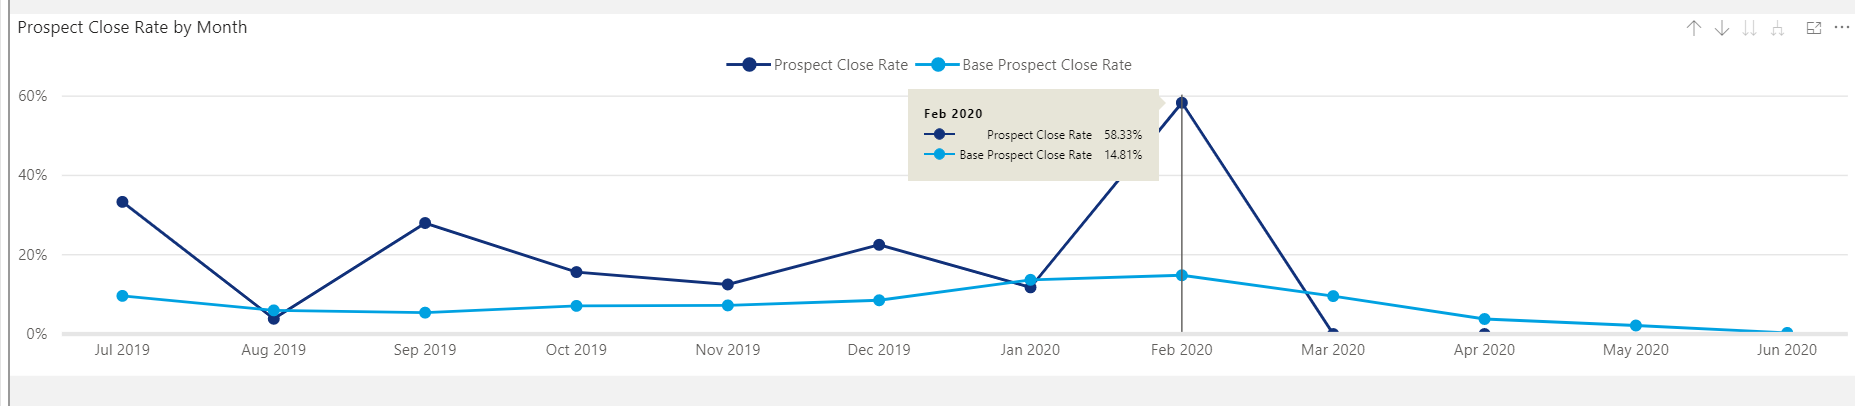
Below the key metrics is a chart showing trends in the percentage of prospect closed sales per month. The two different lines represent the Prospect Close Rate and the Base Prospect Close Rate. The Base Prospect Close Rate doesn't change regardless of the filters, but the Prospect Close Rate will. This is meant to allow you to compare specific sub-sets of data against the brand average. When viewing the report with all filters displaying all data, the two lines on the chart will display the same metrics.
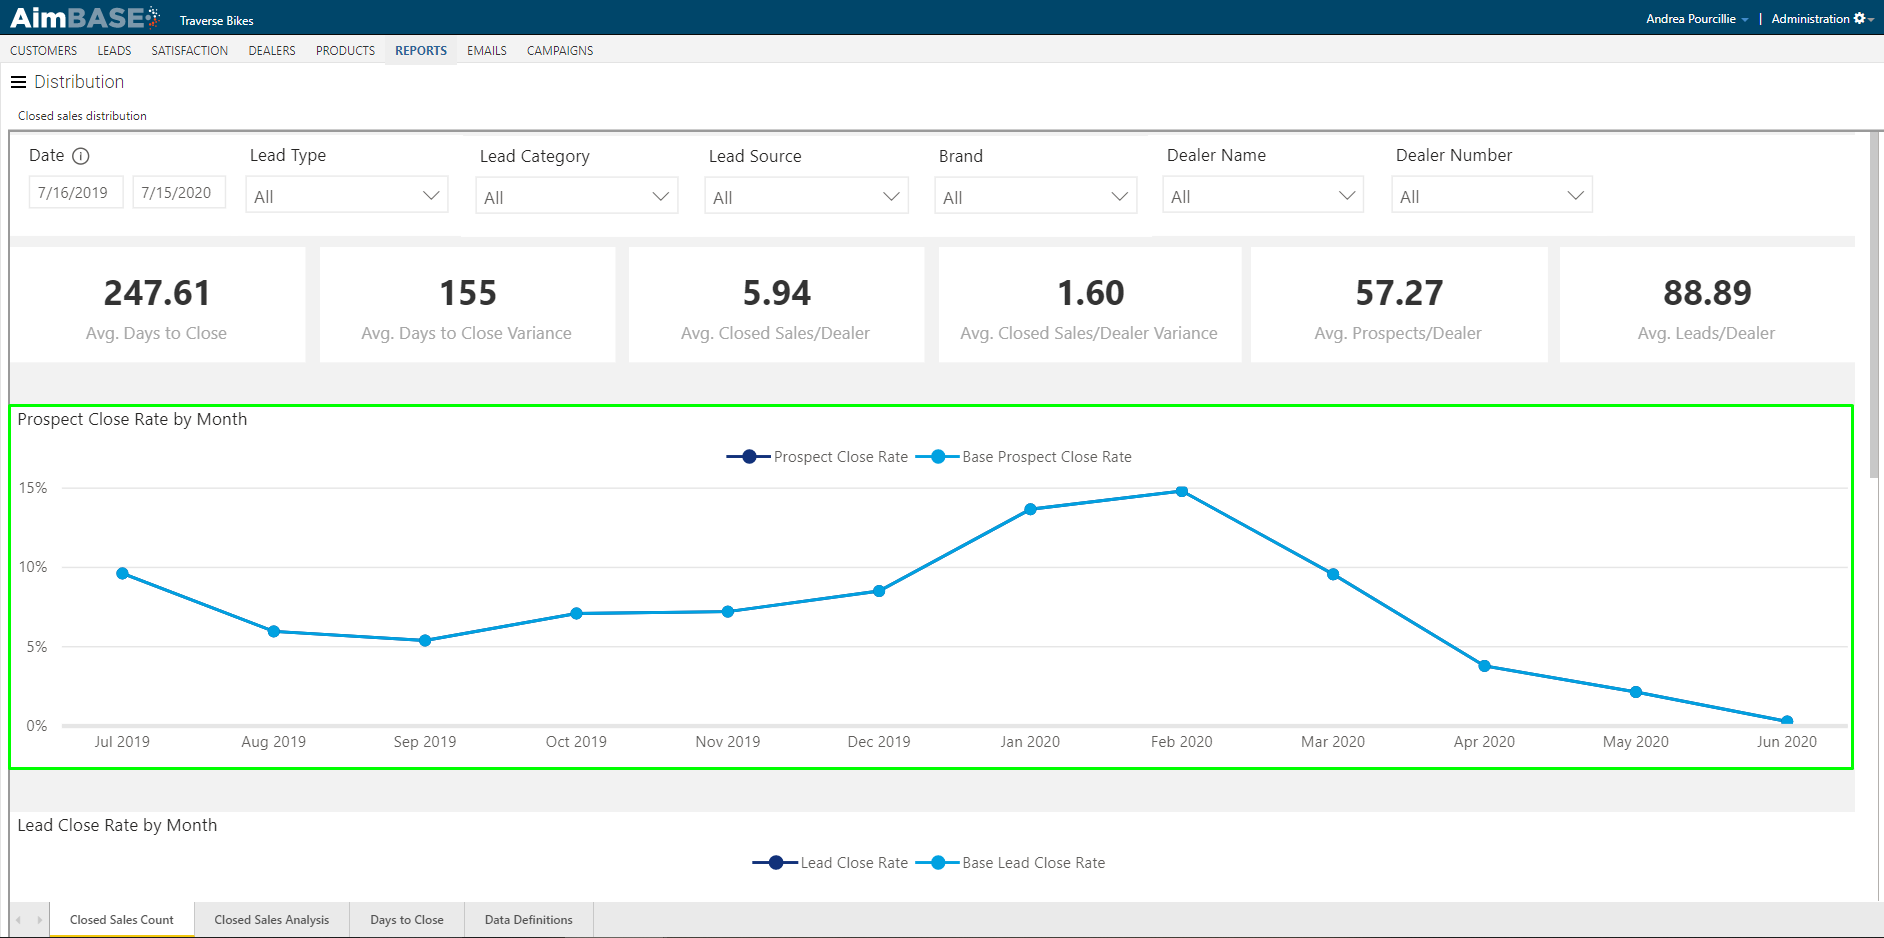
This chart becomes most helpful when filters are utilized. For example, if you wanted to see how a specific dealer's prospect close rate compared against the rest of the brand you could choose a single dealer from either the Dealer Name or Dealer Number filter. In the image below, you can see that for this dealer in February the dealer has a prospect close rate of 58.33% compared to the overall brand close rate, which was 14.81%.
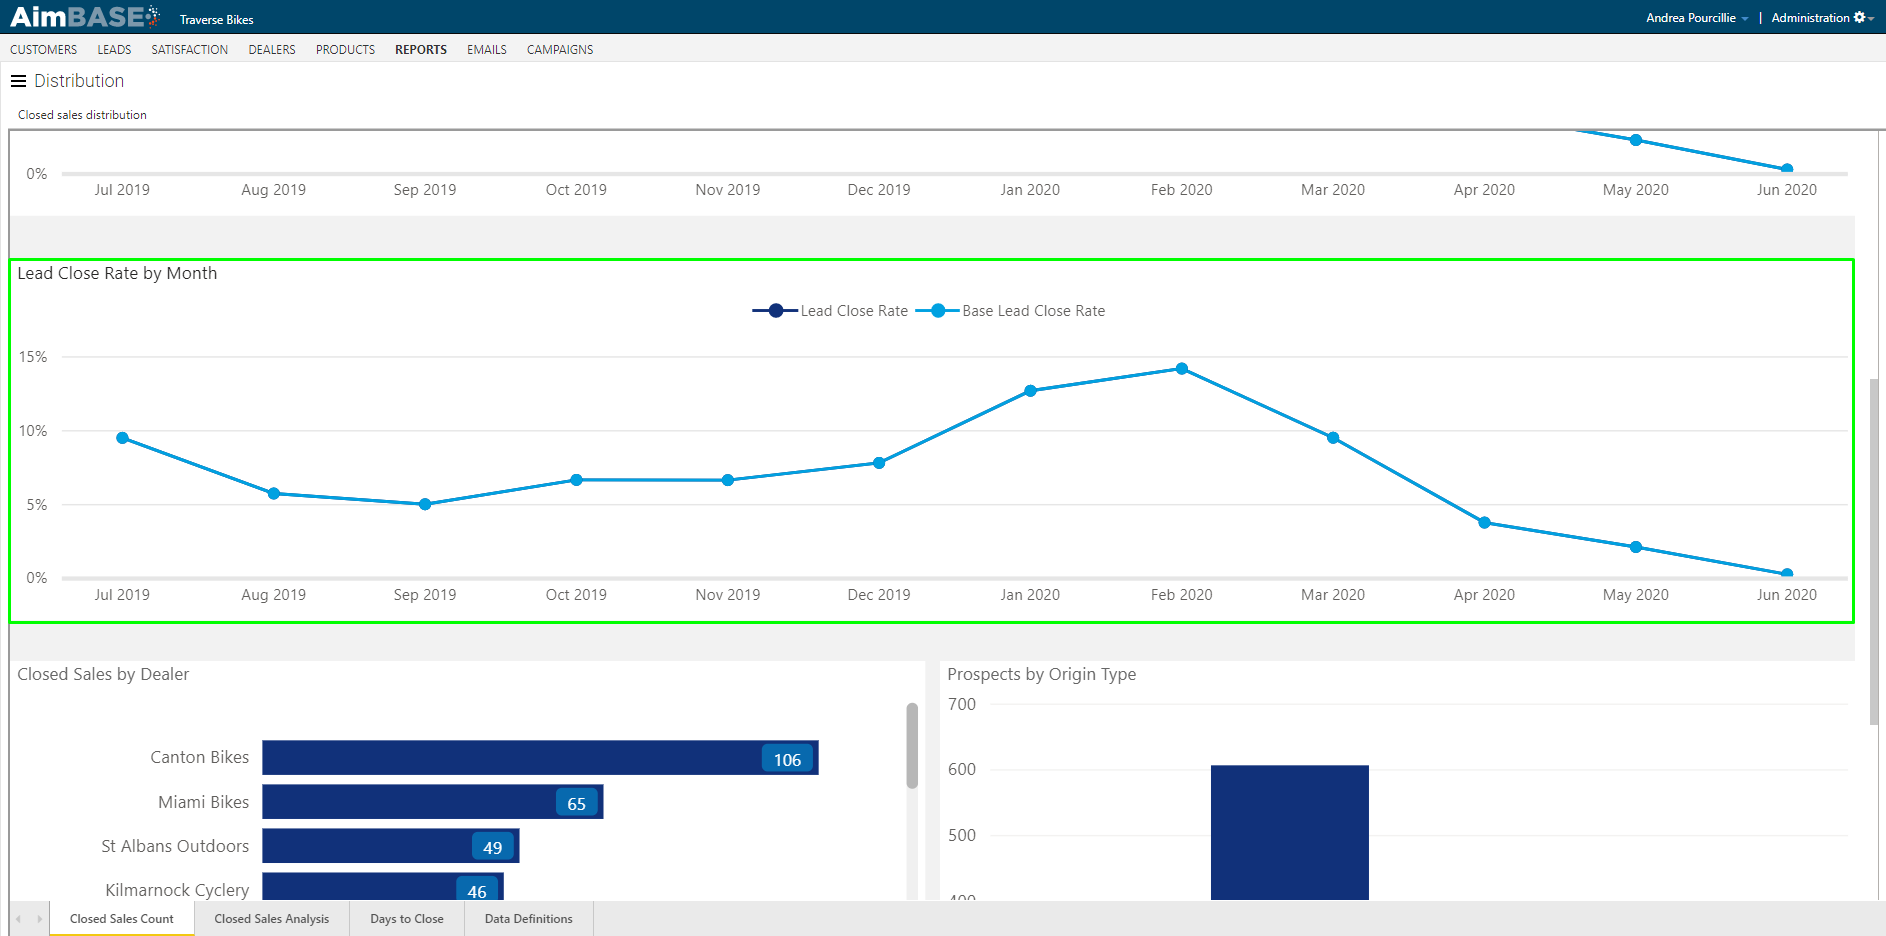
Lead Close Rate by Month
The Lead Close Rate by Month report works the same way as the Prospect Close Rate by Month report. The difference between this module and the prior one is the distinction between lead and prospect. Remember that a prospect is defined as a person and a lead is an instance of one of those people submitting a form. Because of this, the close rates in this module will likely appear as lower due to the higher volume of data being matched to registrations.
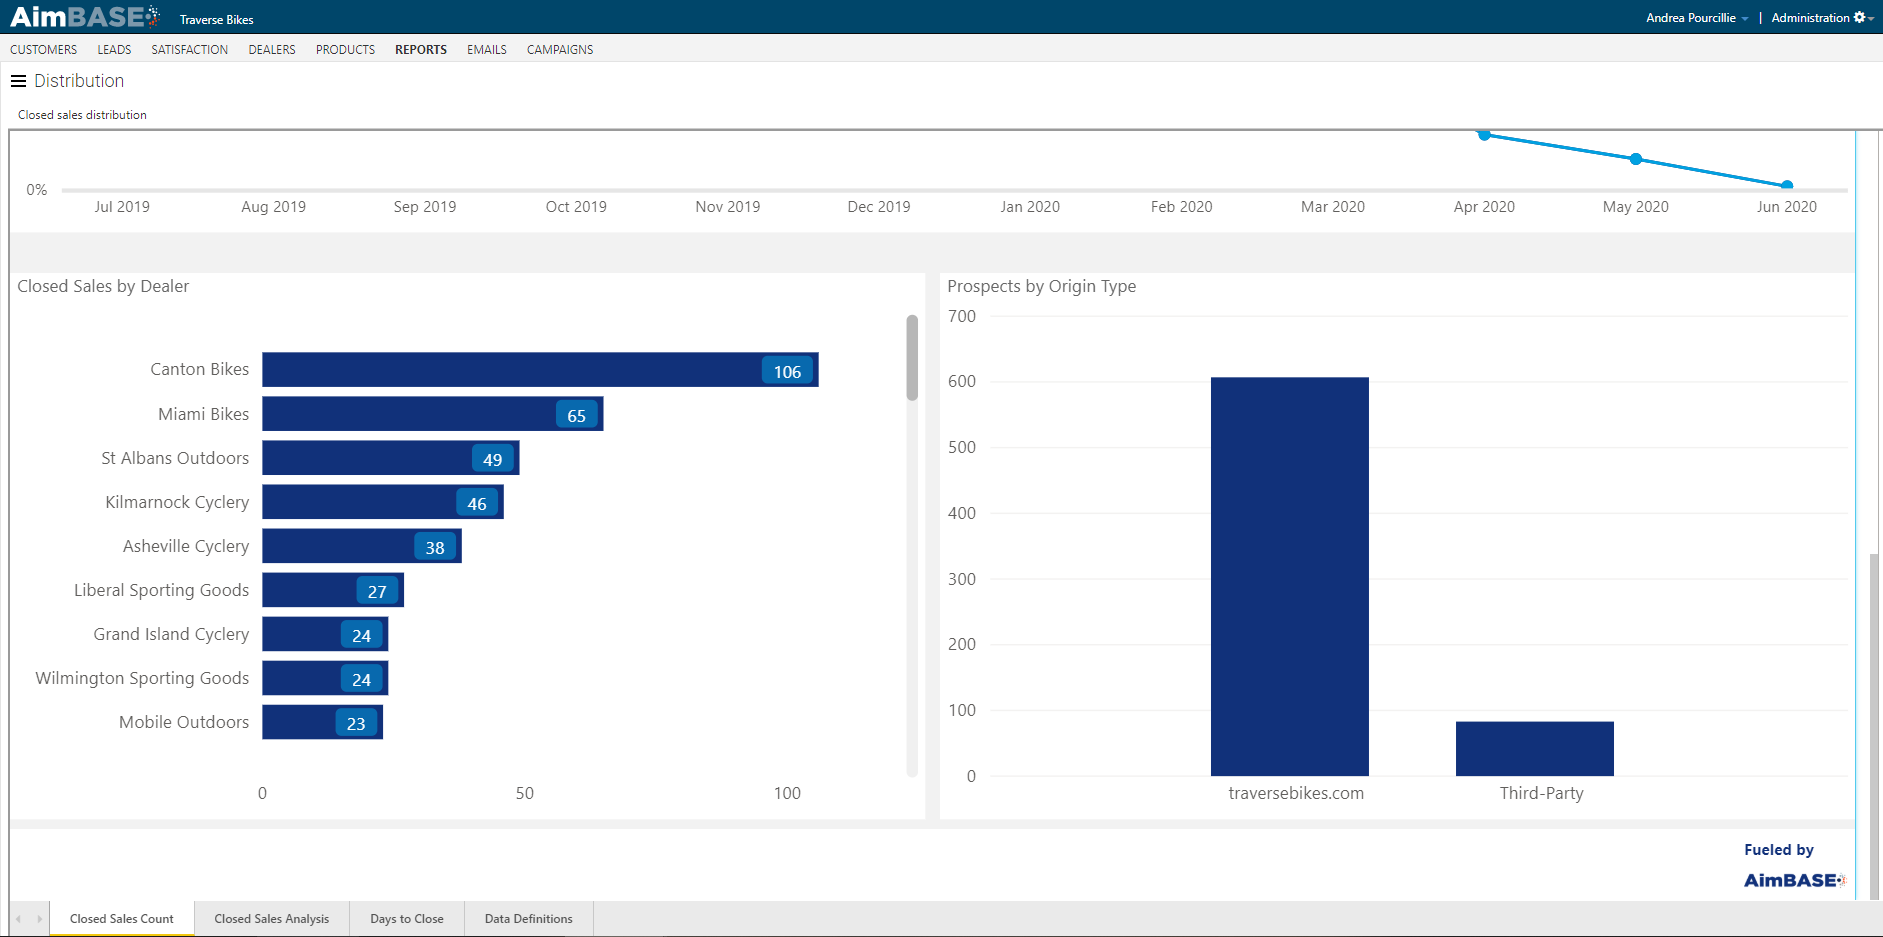
Closed Sales by Dealer & Prospects by Origin Type
The Closed Sales by Dealer module will show you at a glance the total number of closed sales each dealer has produced for the time frame.
The Prospects by Origin Type allows you to see the closed sales arranged by the origin type of the prospect. The prospect origin type is an attribute Aimbase uses to identify how a prospect entered the database. For example, if a person never enters a lead and is added to the database for the first time as a registration, his/her prospect origin type would be Owner. In the module below, the prospect origin types displayed directly relate to the lead category of the leads that matched to the registrations. This is because all of our closed sales that matched, matched to prospects whose entry into the database was caused by a lead submission.
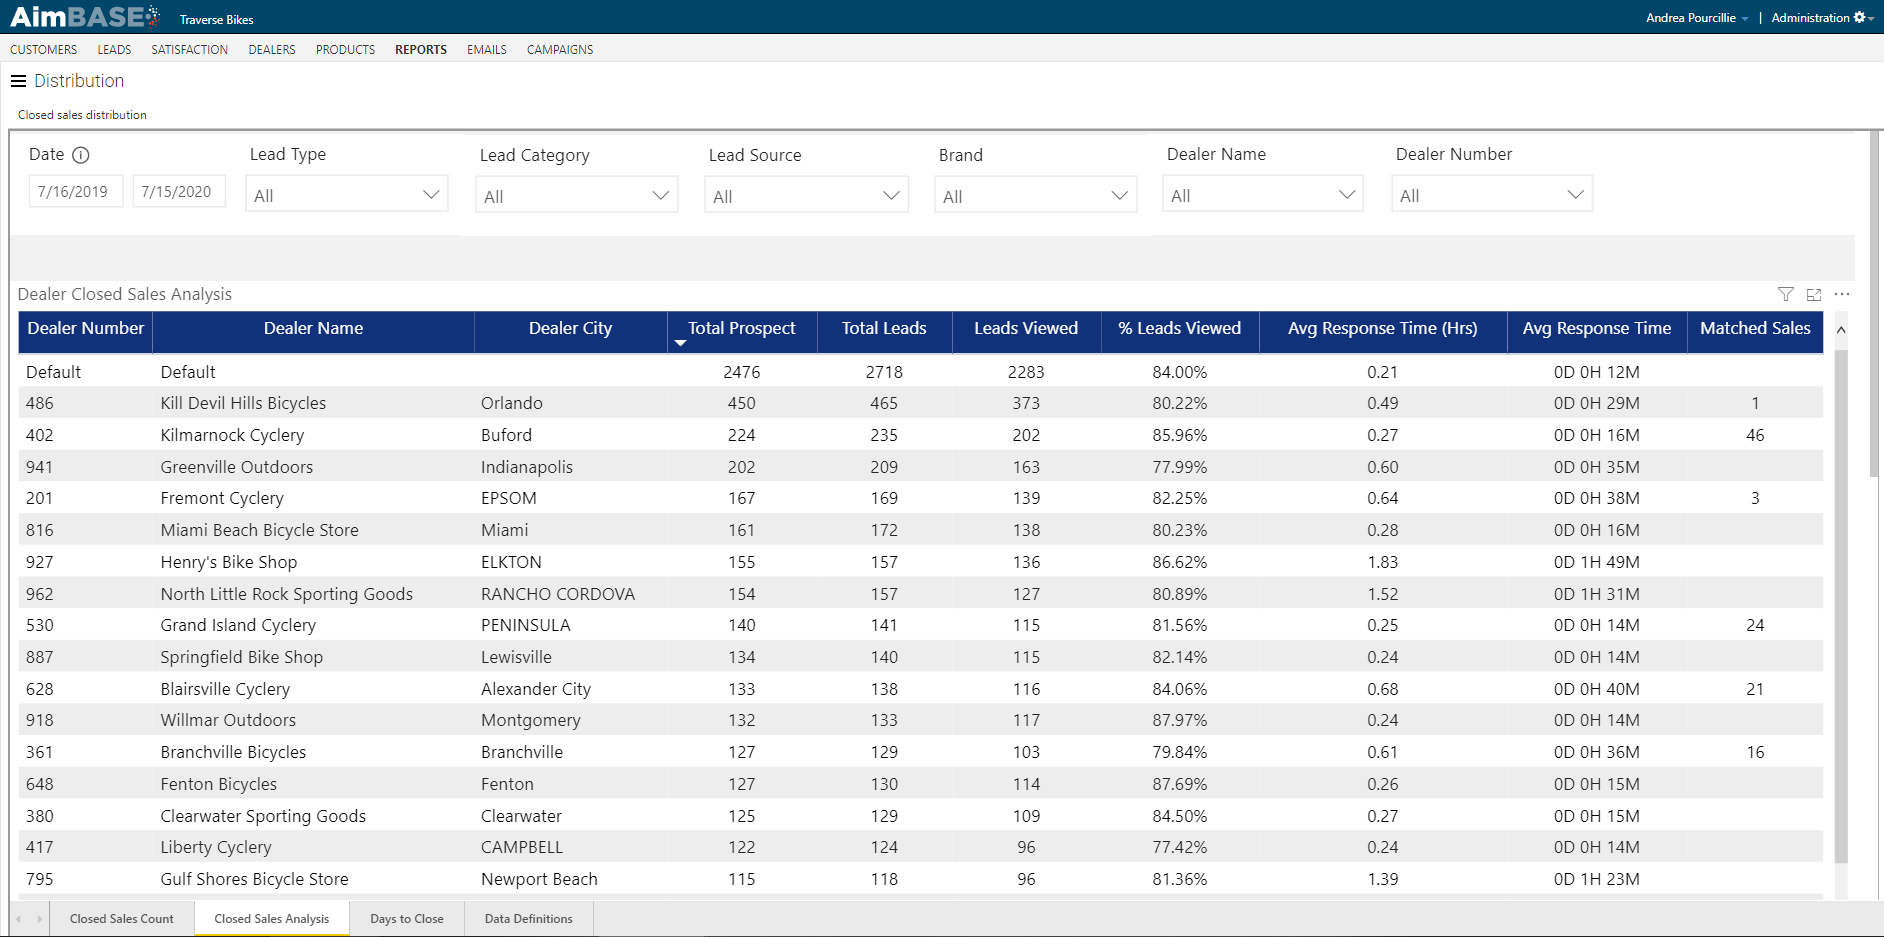
Closed Sales Analysis Tab
The Closed Sales Analysis tab shows you a more detailed look at several key metrics for you dealers that allow you to gauge their interactions with your data. From this table you're able to see how many prospects and, subsequently, leads have been assigned to each, how many have been views and how quickly. Finally, you can also see from this page the total number of matched sales. Because there are likely many stakeholders within an organization who may be interested in this data, this is a good module on which to utilize the data export function.
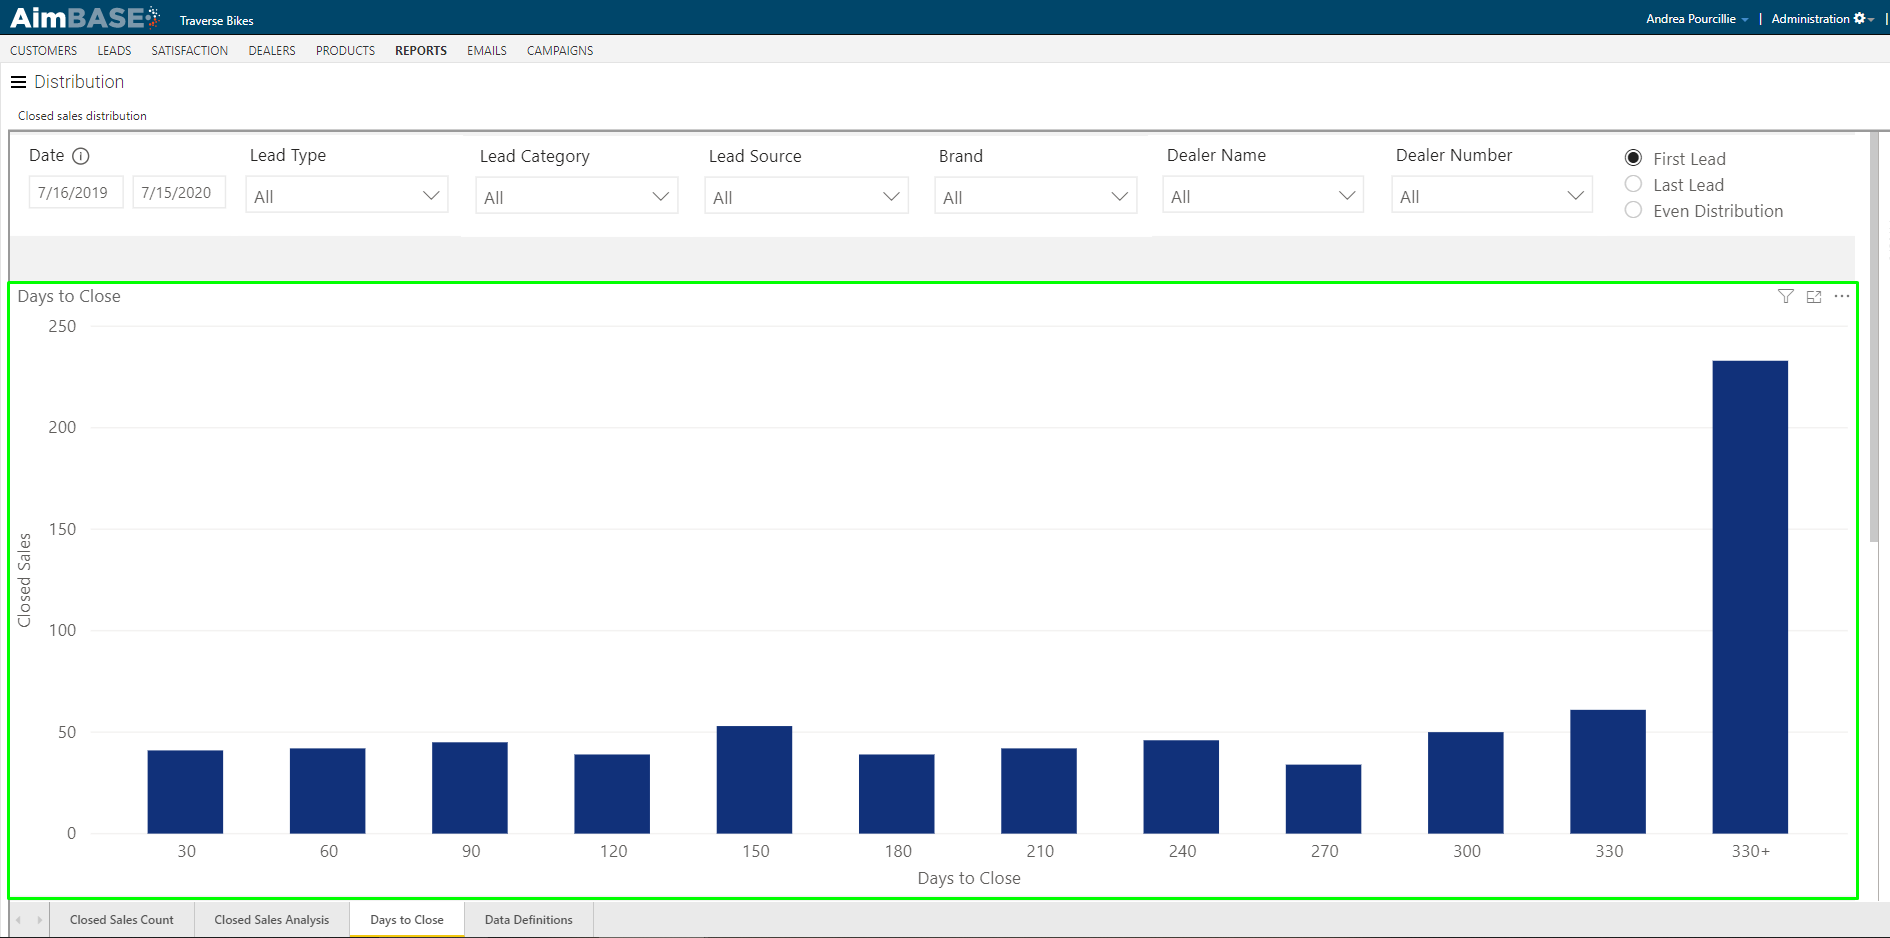
Days to Close Tab
The Days to Close tab exposes valuable information relating to how soon after a lead is submitted the person purchases the product. This tab offers a few different ways of viewing this data, but the goal is to help you understand more about your customers and the sales cycle for your brand(s).
An important note about this tab, which differs from others in this report, is the ability to toggle between the first lead, last lead and an even distribution of leads. To explain why this is relevant, lets consider an example of a buyer's journey.
John Doe is in the market for a new bike, but he is new to bicycling and unsure of which product is right for his need. To begin educating himself, John D. submits a form on the request a brochure download page. After spending some time reading over the brochure, he has narrowed his search down to two bikes and comes back to the site to submit a build-a-bike form for each. Once he has completed his builds, he reviews the information one last time and decides which bike he plans to purchase. He enters one final lead on the contact a dealer form, connects with the dealer, and purchases his new bike. In total, John D. has submitted 4 leads throughout his search for a new bicycle.
When it comes to analyzing the data on this tab you'll want to consider if you'd like to measure it based on the first lead, last lead or an even distribution. In the context of the example above, choosing first lead would give the credit of the matched sale to John D.'s request a brochure lead. Choosing last lead would give credit of the matched sale to his contact a dealer lead. Choosing even distribution would give 25% of the credit to each of the 4 leads he submitted.
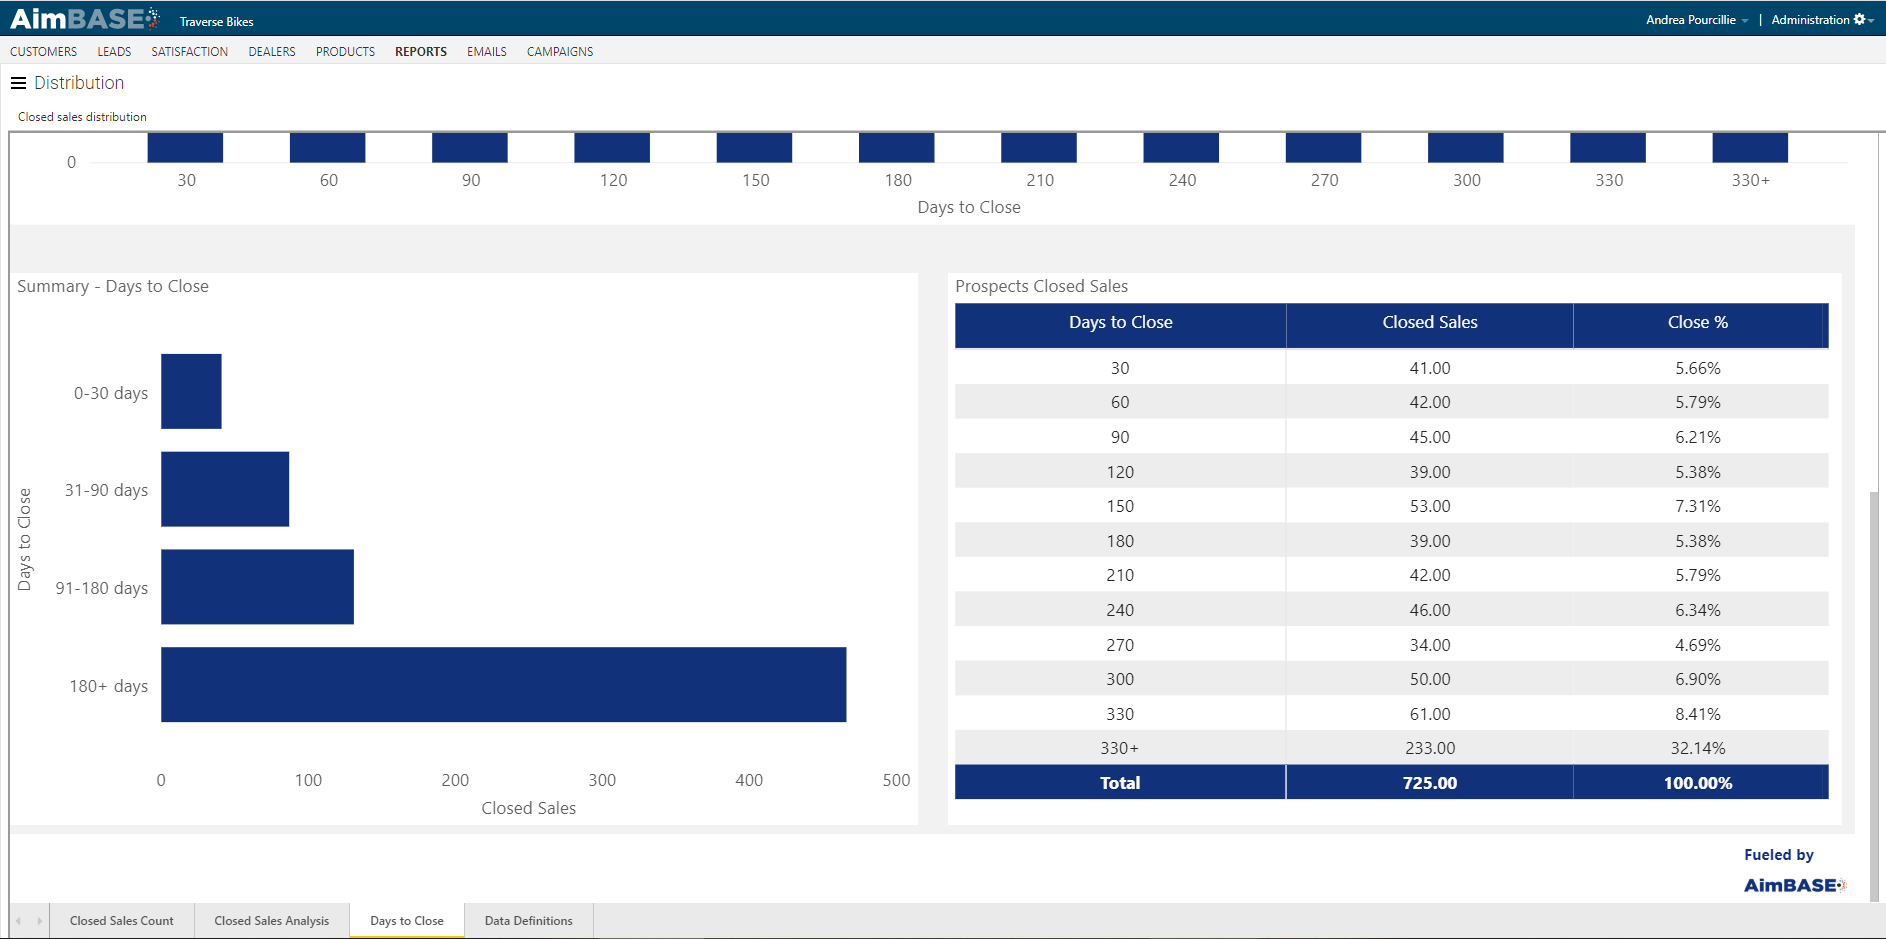
Days to Close
The Days to Close module shows bars representing a range of days following the receipt of a lead. The height of the bar represents the number of sales that matched to a lead, and how many days after a lead the sale occurred. The first bar includes data that falls within a 0-30 day range, the second a 31-60 day range, the third a 61-90 day range, and so on.
Summary - Days to Close & Prospect Closed Sales
The Summary - Days to Close module displays very similar data as the above. The difference in this view is how the data is bucketed. The Summary view simplifies the data ranges.
The Prospect Closed Sales module displays a grid version of the data within the first Days to Close module. In this view, you're also able to see what percentage each bucket of time represents of all closed sales for the time frame.