The Email Sends report allows you to see email delivery and interaction performance at a high level. From this report, you can see how often your emails are being opened or clicked and what the recipients clicked.
A new level of transparency that the Email Sends report also makes available is seeing this data for dealer notification emails as well. While the most value comes from seeing what consumers are doing with the emails you're sending, there is also value in being able to determine open rates and click-through rates on dealer emails such as lead notifications, HIT activity, and hot alerts.
Watch the Email Sends Dashboard Video
What information does the Sends tab provide?
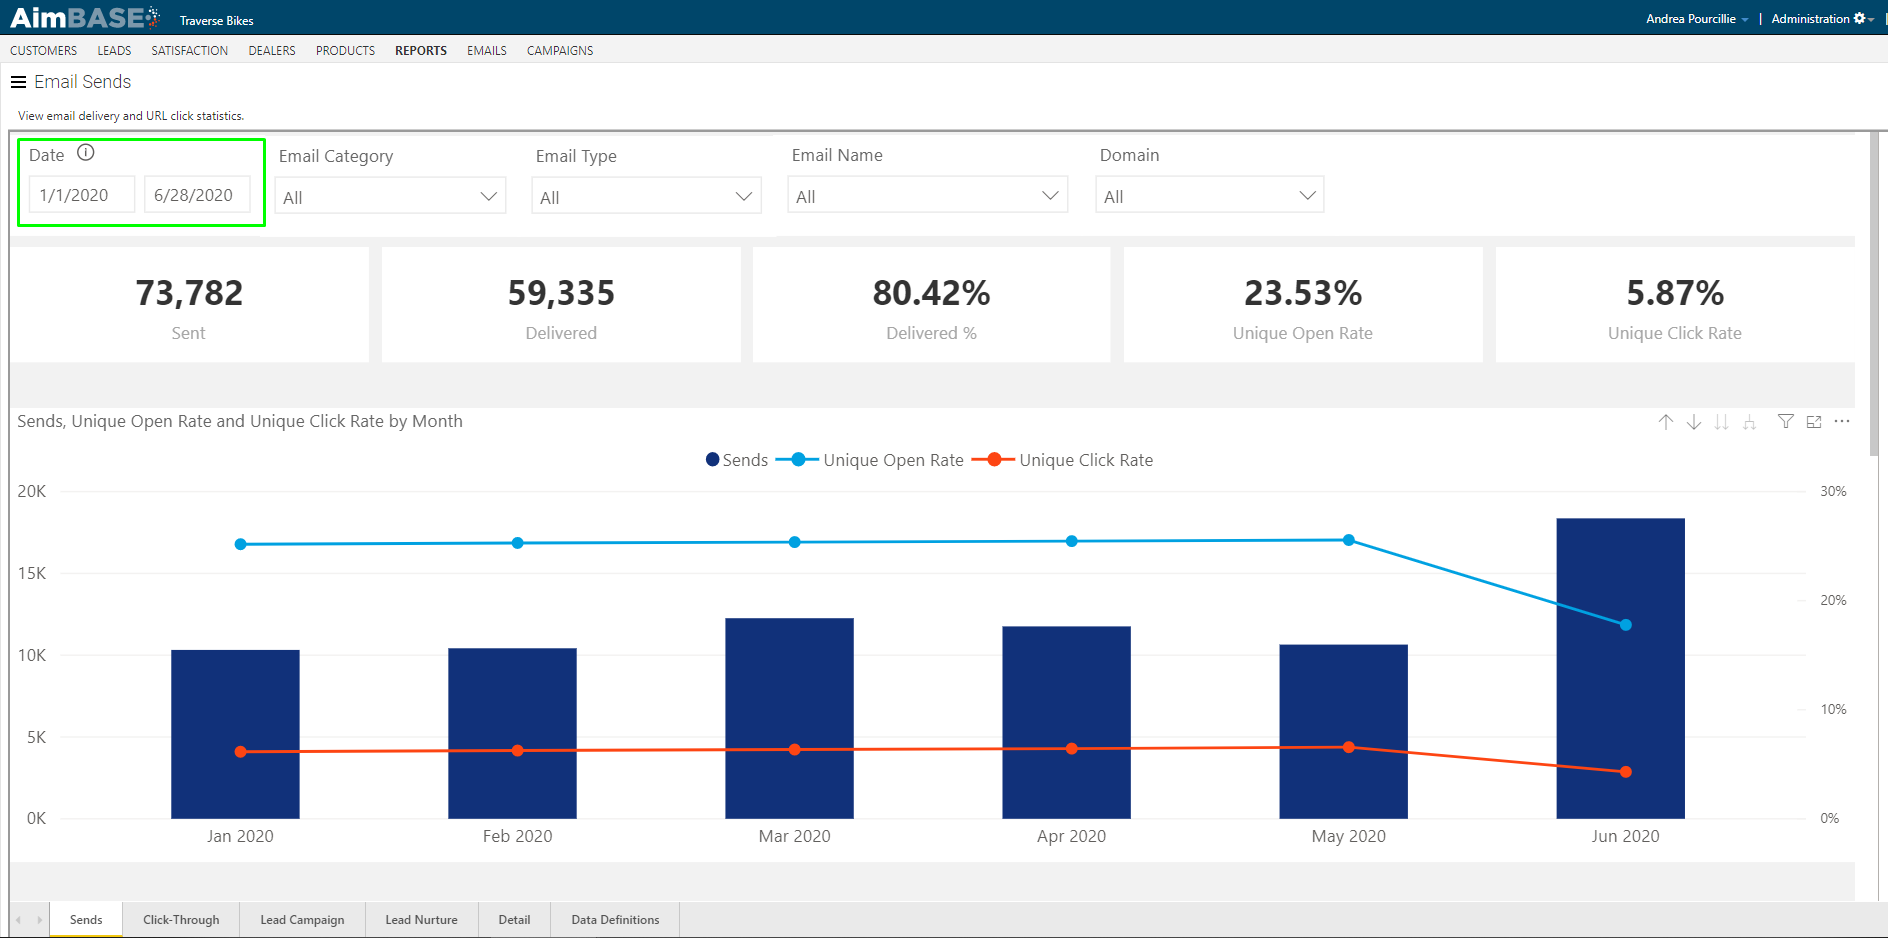
Beginning on the Sends tab, there are a series of filters that allow you to scale back the data you're reviewing in a more targeted manner. The most important filter to start with is the data filter. Setting the date range will determine the data displayed in the report from email sends. When viewing data for a specific date range, something to keep in mind is the date an email is sent relative to the end of that range.
In the example below, the date range ends on 6/28/2020. If you sent an email on 6/27/2020, it is likely that people will still be opening it and clicking it on the 28th and beyond. Even if the date you filter on falls shortly after an email is sent, the data (opens and clicks) relating to the send that occurs after the 28th will appear within the report. Because of this, the data could appear differently on 6/29 than it does on 6/30 if people have continued to interact with emails from before the 28th.
When you initially load the report, you'll notice that there is a filter set on the Email Type. The Email Types that are chosen by default are used for Lead Autoresponders, Lead Nurtures, and Campaign emails. In short, the report is set up to show you data relating to, primarily, consumer-facing Email by default. You can view data for all Email Types by clicking on the down arrow for that dropdown and selecting all other values. Any filter you set will impact data on all tabs of the report.
What KPIs does the Email Sends Report show?
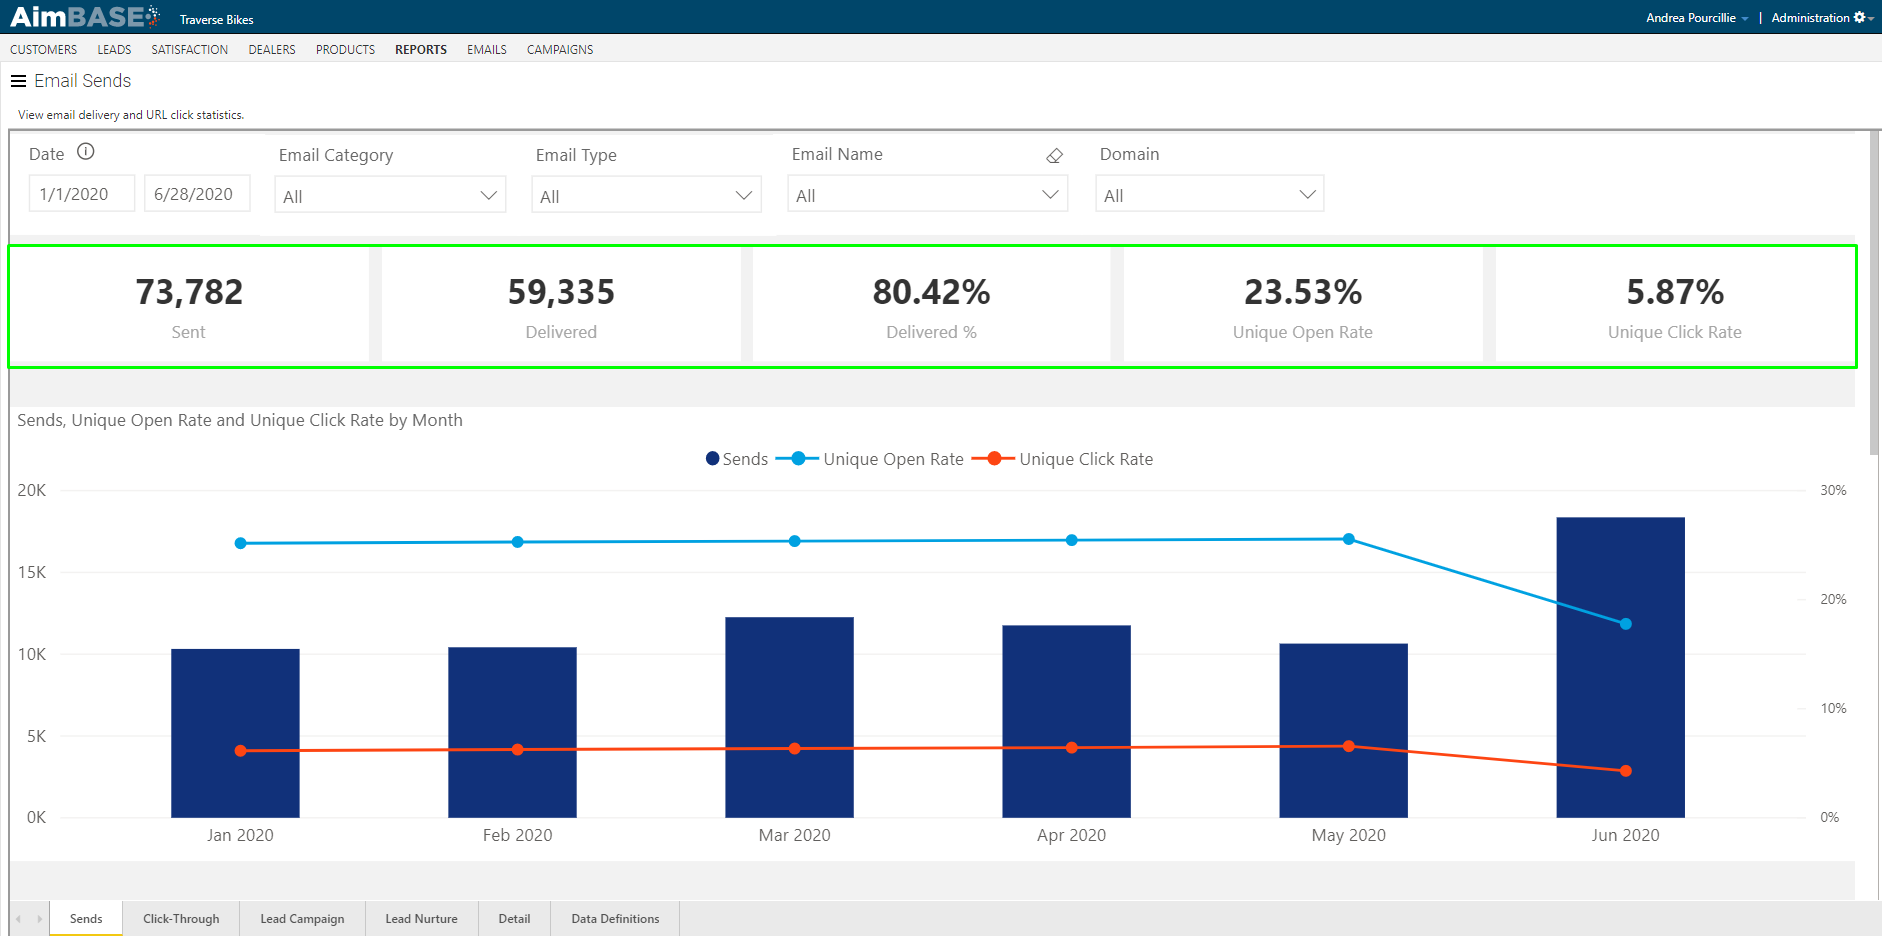
Below the filters are the first metrics of the report. These key performance metrics allow you to see, at a glance, total sent emails, total delivered emails, the delivery percentage, unique open rate, and unique click rate.
The number of delivered emails will always be lower than the number sent due to the fact that consumers occasionally provided bad email addresses (whether intentionally or not). Consider the age of the lists that you're sending to as well. It is not uncommon for people to deactivate inboxes, have a full inbox, or have an autoresponder setup (like an out of office) which will impact an email's ability to be considered delivered.
Unique open rate and unique click rate will indicate the rate at which the Email was opened or clicked by the person receiving the Email. The fact that these are the "unique" metrics indicates that the data is being deduped prior to the calculation. In other words, if the recipient opens/clicks the Email multiple times, only the first open/click is counted for the calculation.
What does the Sends, Unique Open Rate & Unique Click Rate by Month view show?
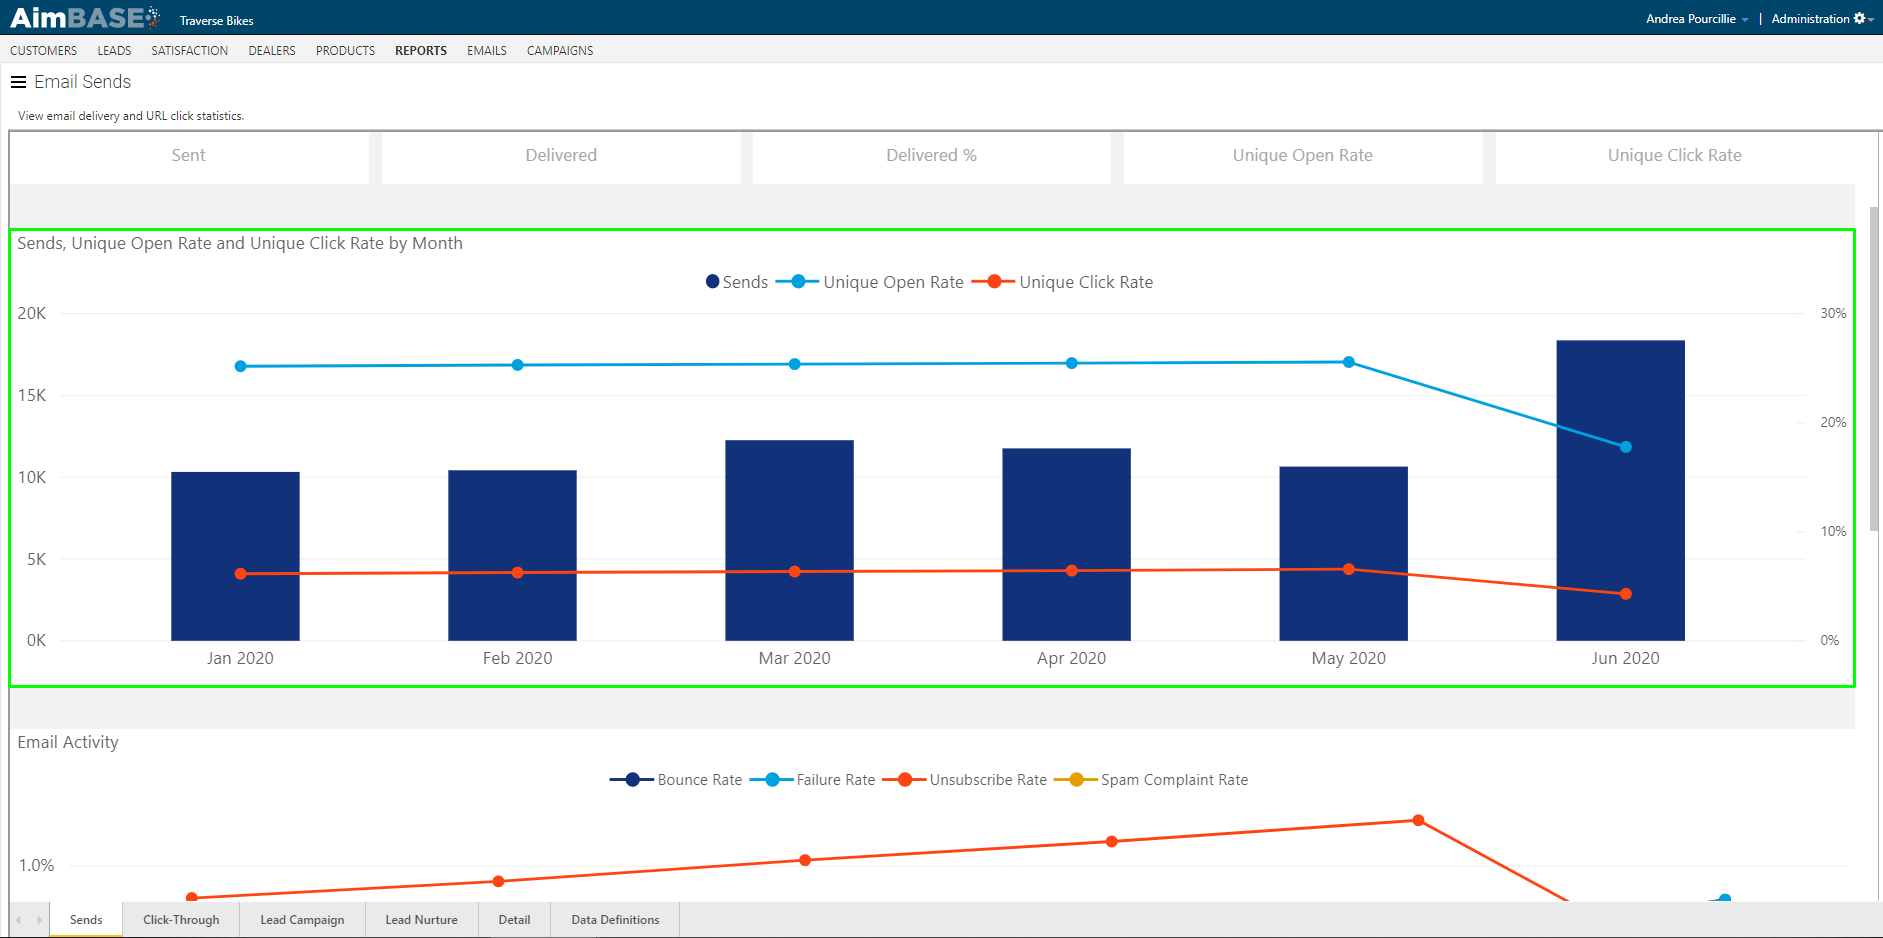
Below the key metrics is another view of the data that allows you to see the volume of Email sends relative to the unique open and click rates. Remember, it is possible to record a click on an email that isn't considered opened. So if ever you notice that the trend link for your unique clicks surpasses unique opens, don't discount the data.
What does the Email Activity section display?
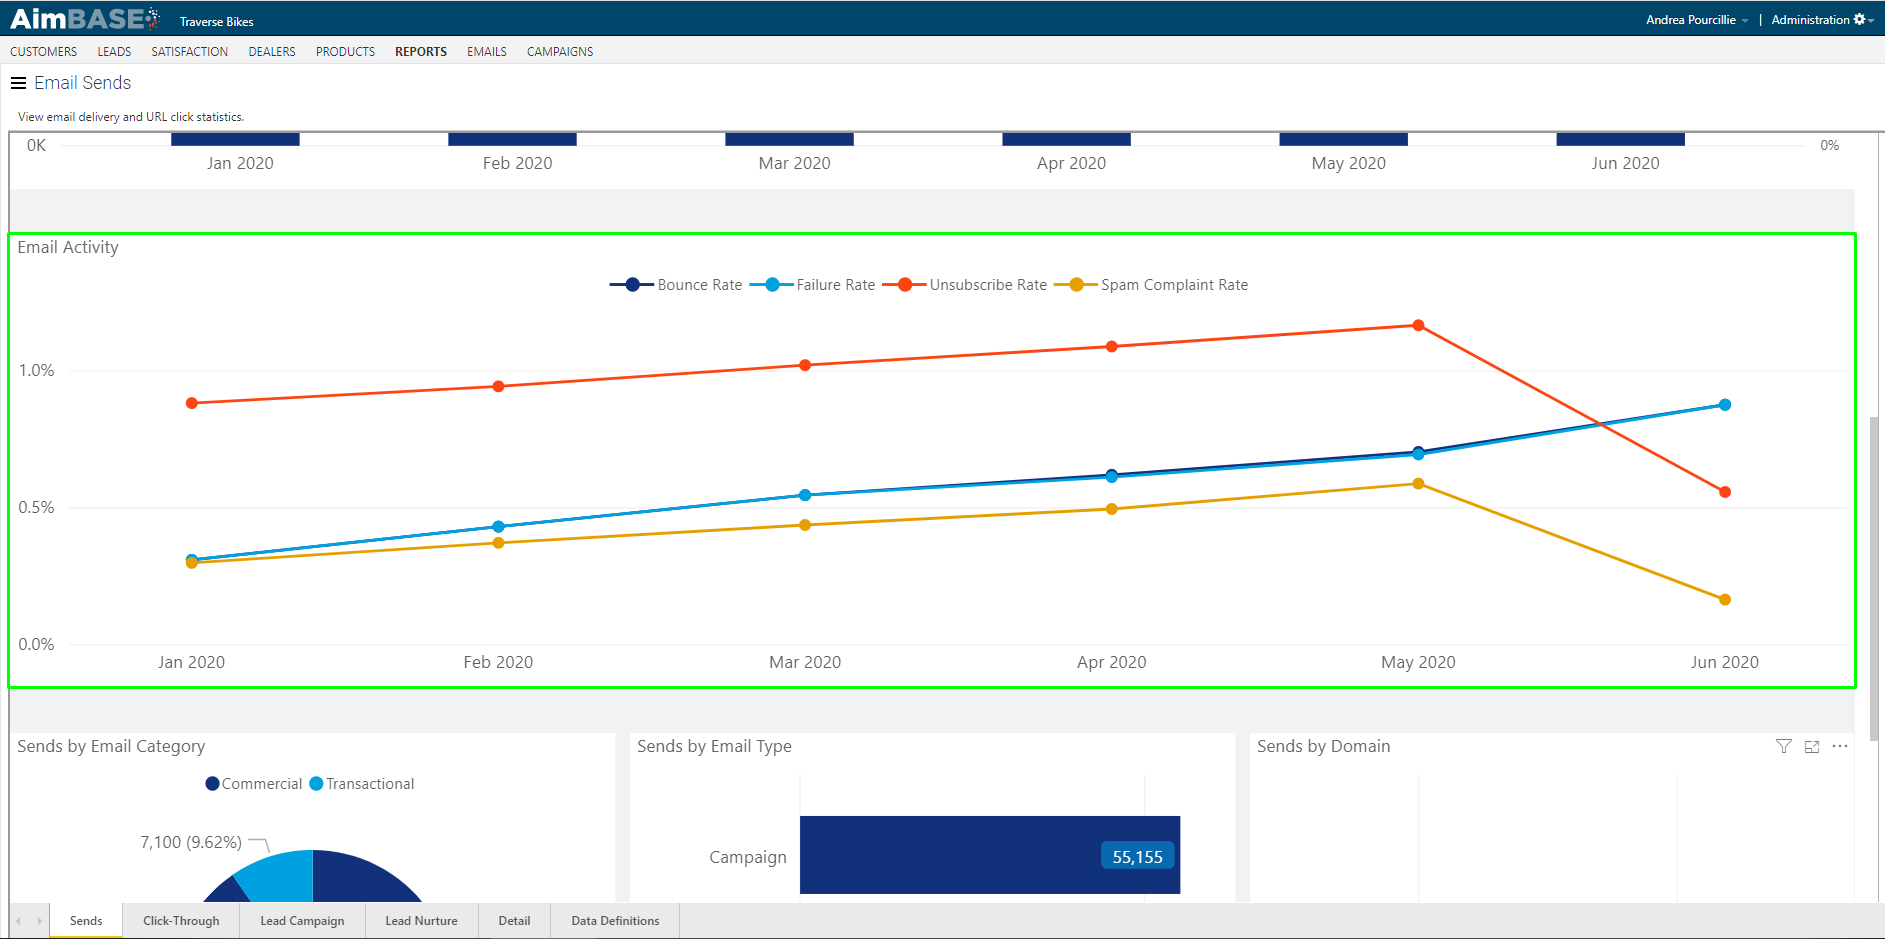
The next module in the report displays the rates at which your sent emails have bounced, failed to be delivered, and been unsubscribed from. The yellow line represents emails that were delivered but were flagged as spam by the recipients. A failed email is a good indicator that the email address provided was not valid, but an email address that is bounced could be for a variety of reasons. Some examples of common reasons an email bounces are full inboxes, temporarily inactive inboxes, or the recipient's email server is down.
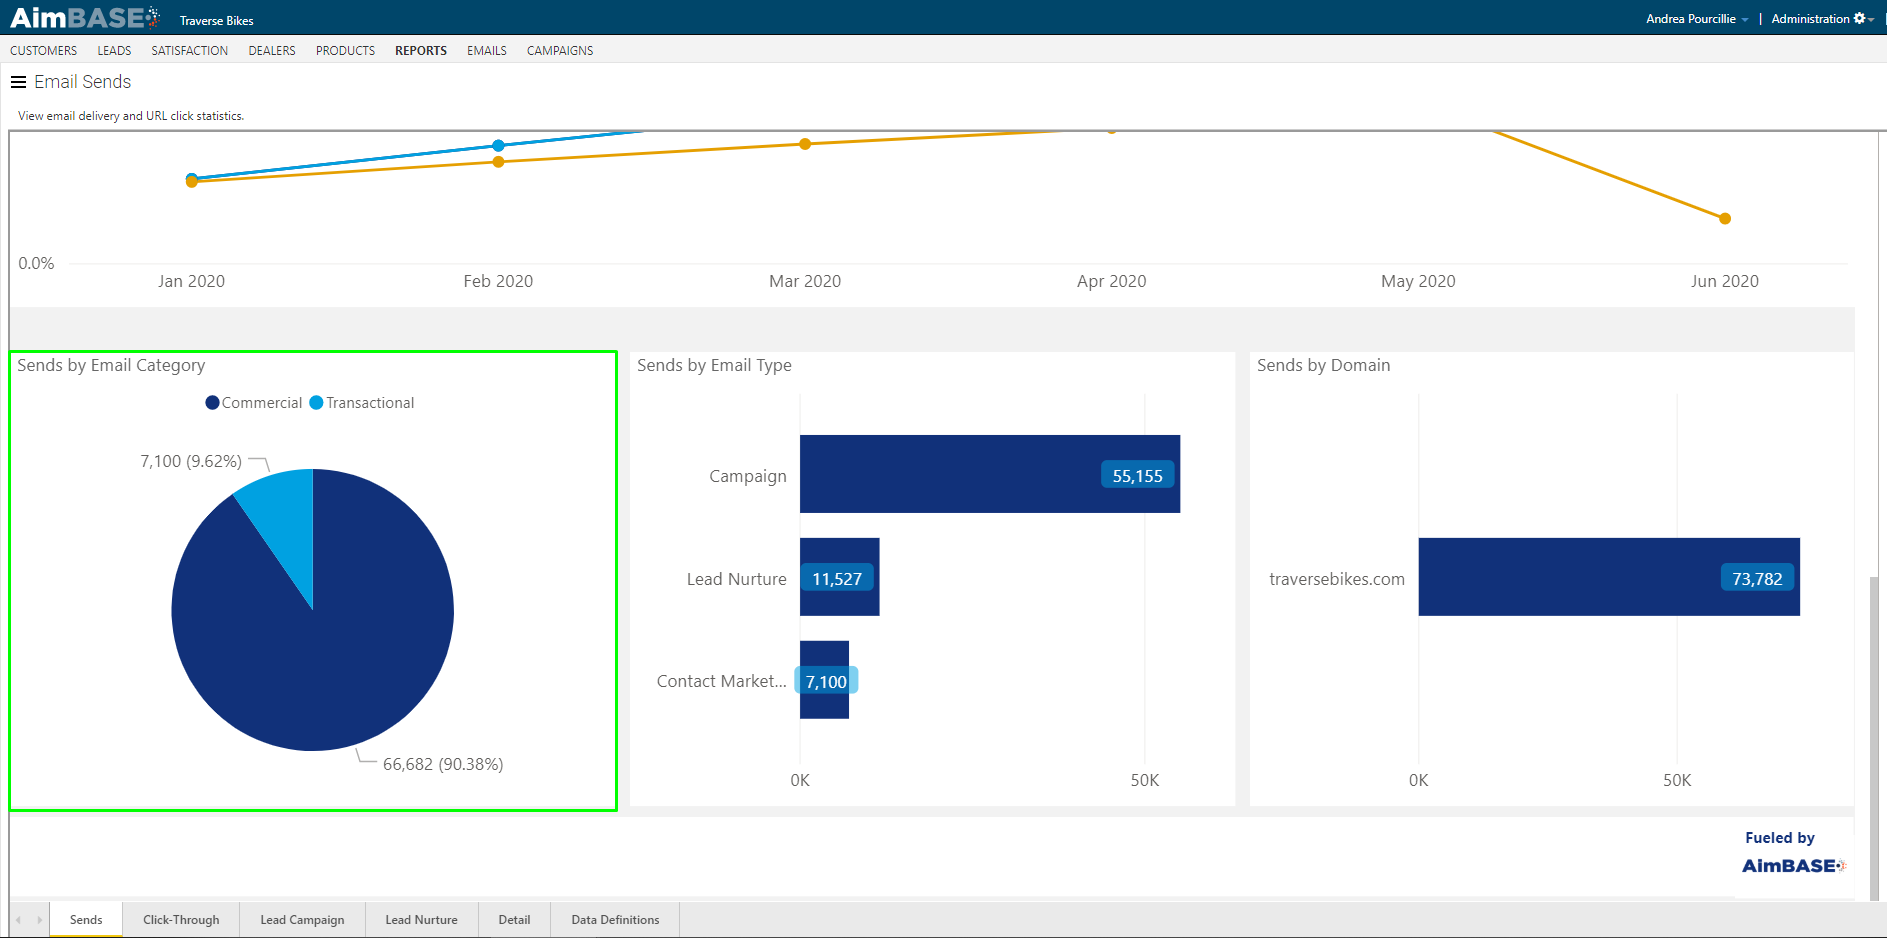
What does the Sends by Email Category section show?
Sends by Email Category will show you what portion of your emails are commercial versus transactional. Transactional emails include lead autoresponders, lead notifications to dealers and OEMs, and other notifications relating to owner surveys.
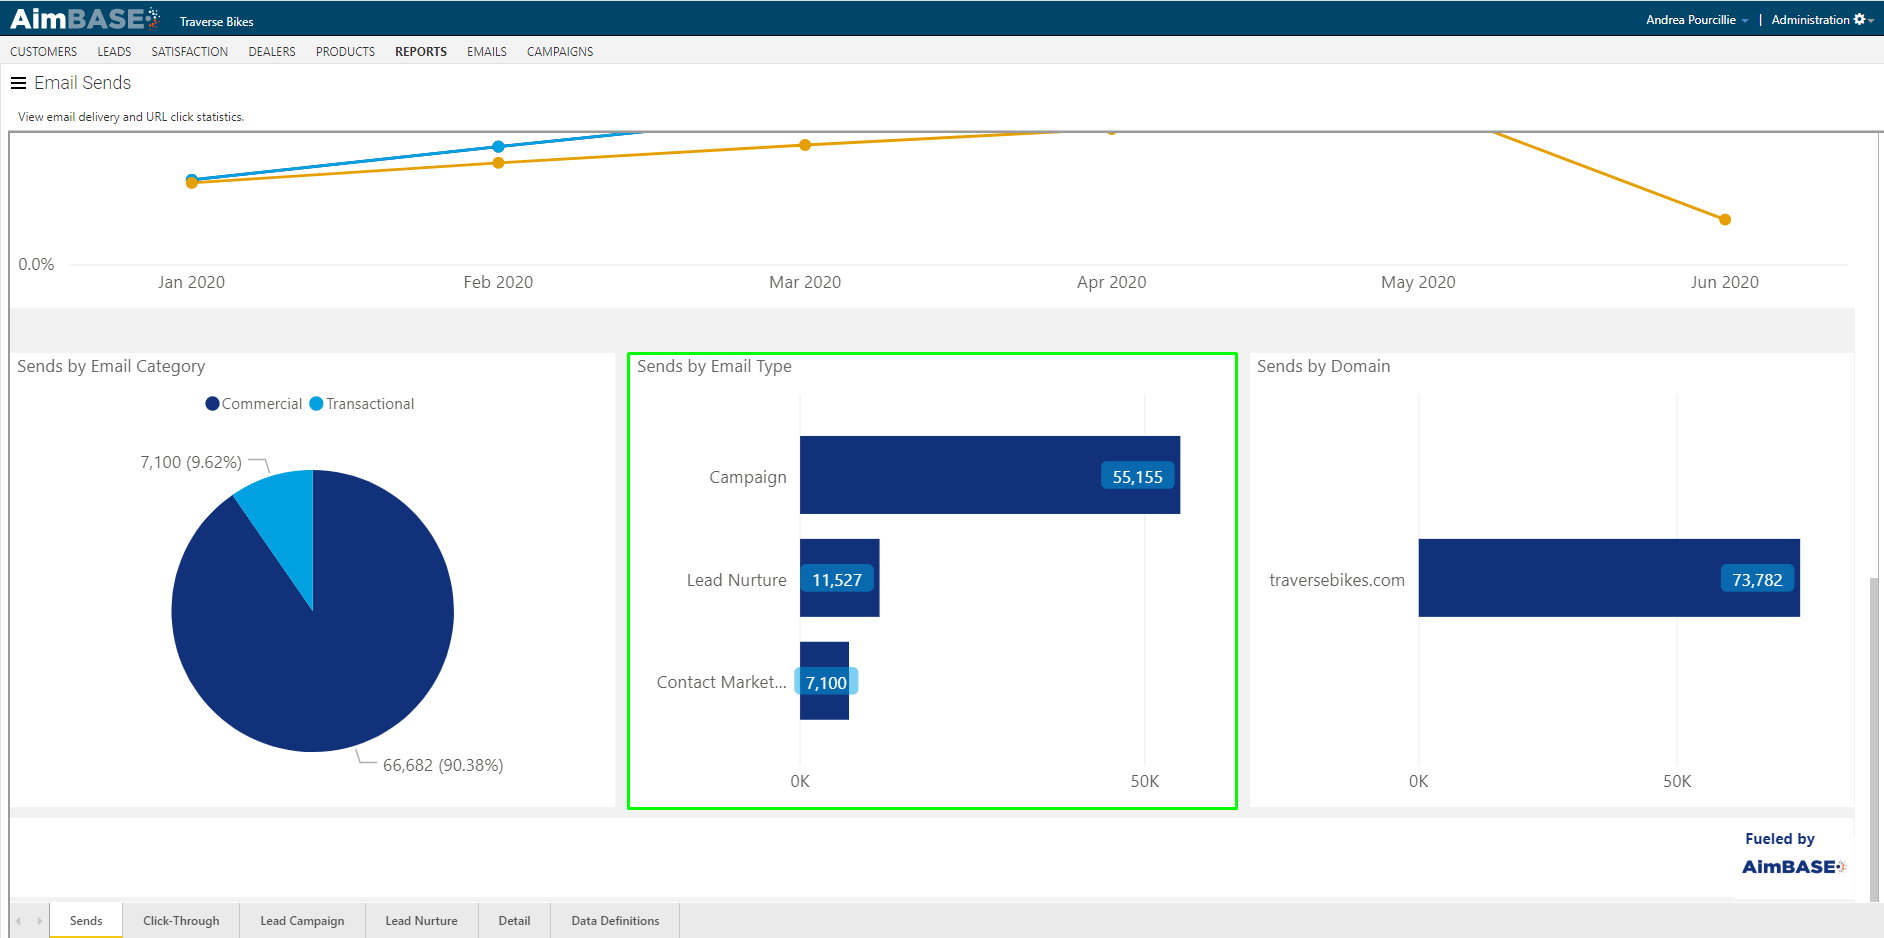
What does the Sends by Email Type section show?
Sends by Email Type will break down how your email sends are distributed across the various types of emails. Email Types are used to distinguish between emails such as campaign sends (manually scheduled email blasts), lead nurture sends, lead autoresponder sends, content marketing notifications (notification emails sent to dealers and manufacturers), and more. For a full list of emails types and their uses, you can refer to the email types section of the glossary.
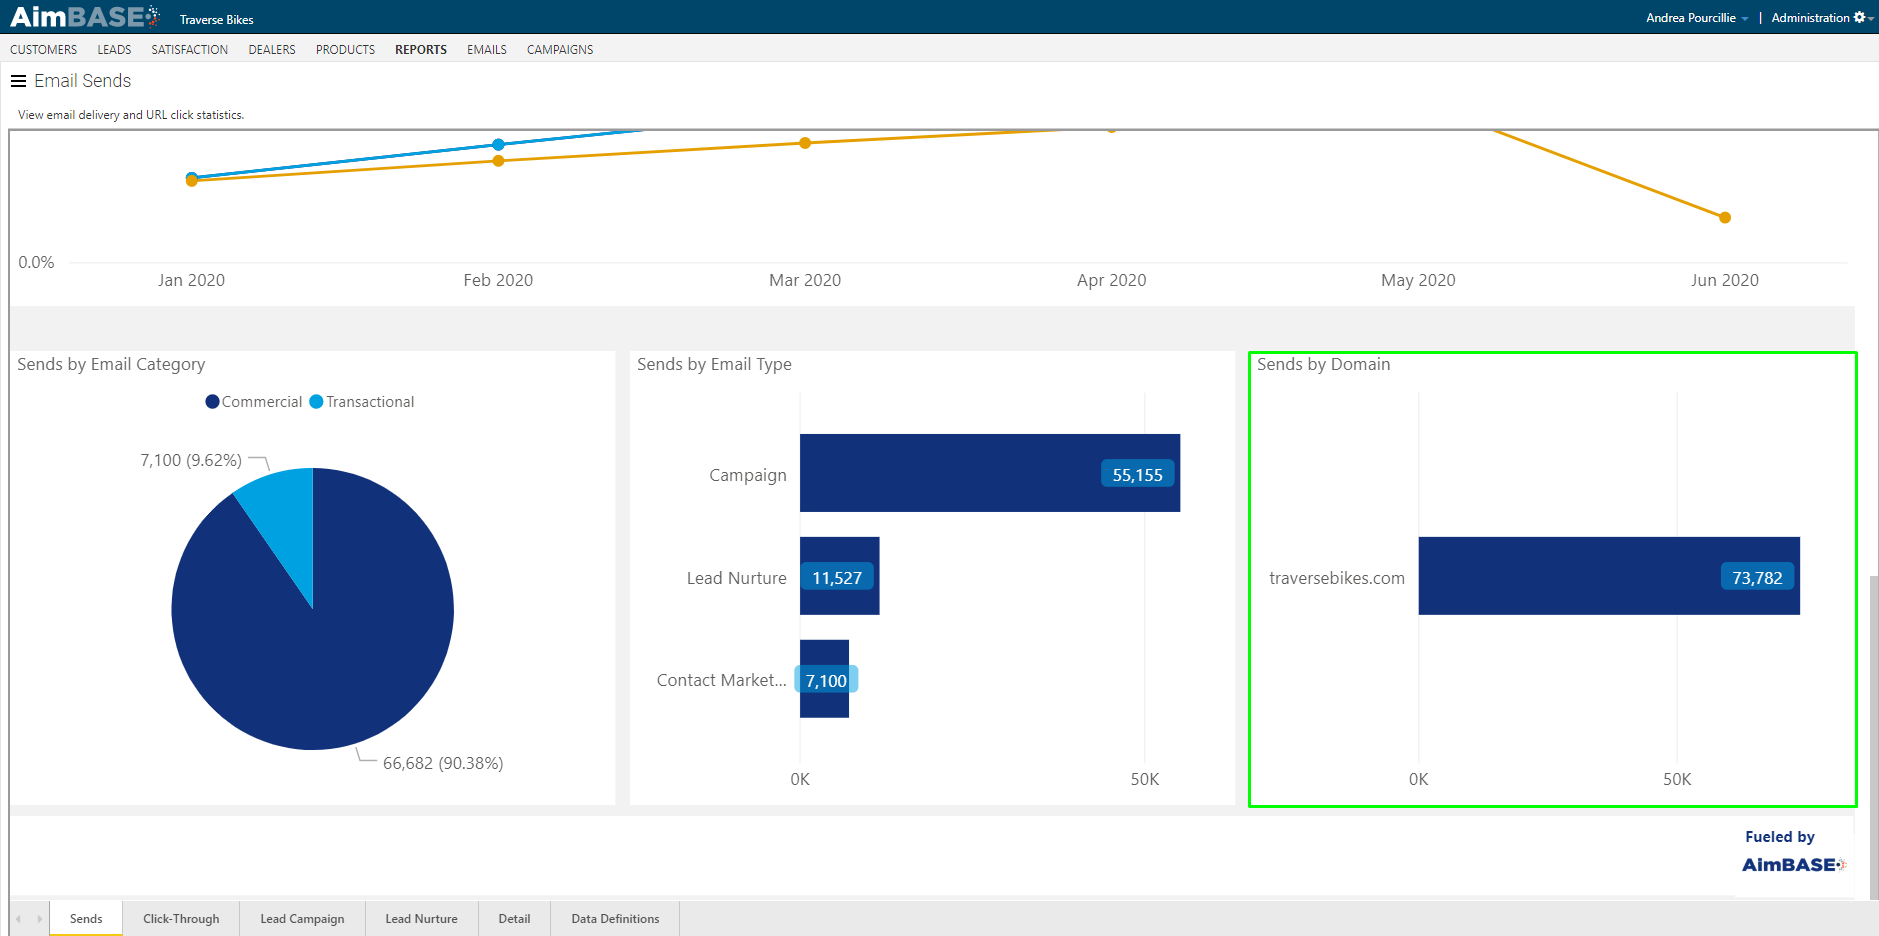
What does the Sends by Domain section show?
Sends by Domain will break down how your email sends are distributed across your available email domains. Keep in mind that it is best practice to have one domain dedicated to commercial emails, one for transactional emails, and another for notifications to dealers.
Watch the Email Sends Click-Through Video
What information is available in the Click Through tab?
The data in the click-through tab displays which links within your emails are getting the most clicks. These links are rolled up based on the title of the link. Each link's title is set within the Email itself from the Links tab. The link title is the name you've given to each link. These names are meant to indicate more information about where the link is ultimately taking the consumer without having to look at the entire URL.
What does the Unique Clicks Trend by URL Title & Unique Clicks by URL Title section show?
The first module displays the top five links (by title) that have been clicked within your emails along with trends in the volumes of each title. In the second module, you'll see a full list of the titles that have received click activity from within your emails. If you see a large number of Untitled links, then you may want to read this article about how best to utilize this function within Aimbase.
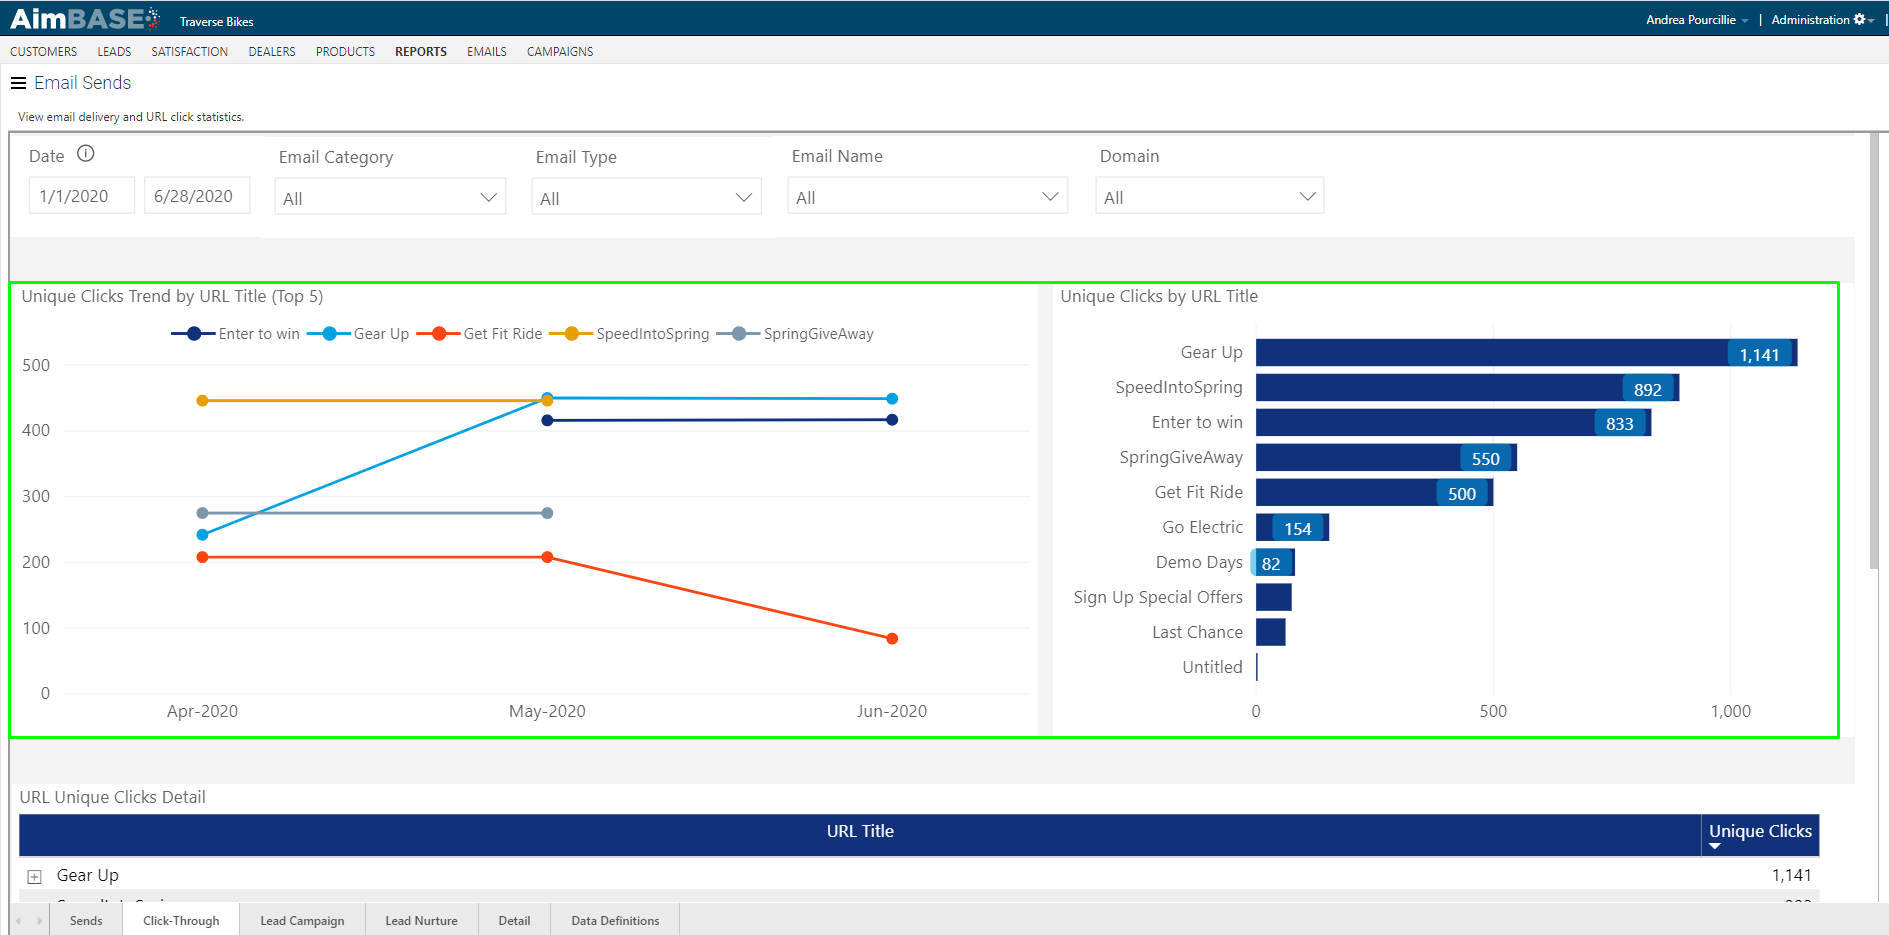
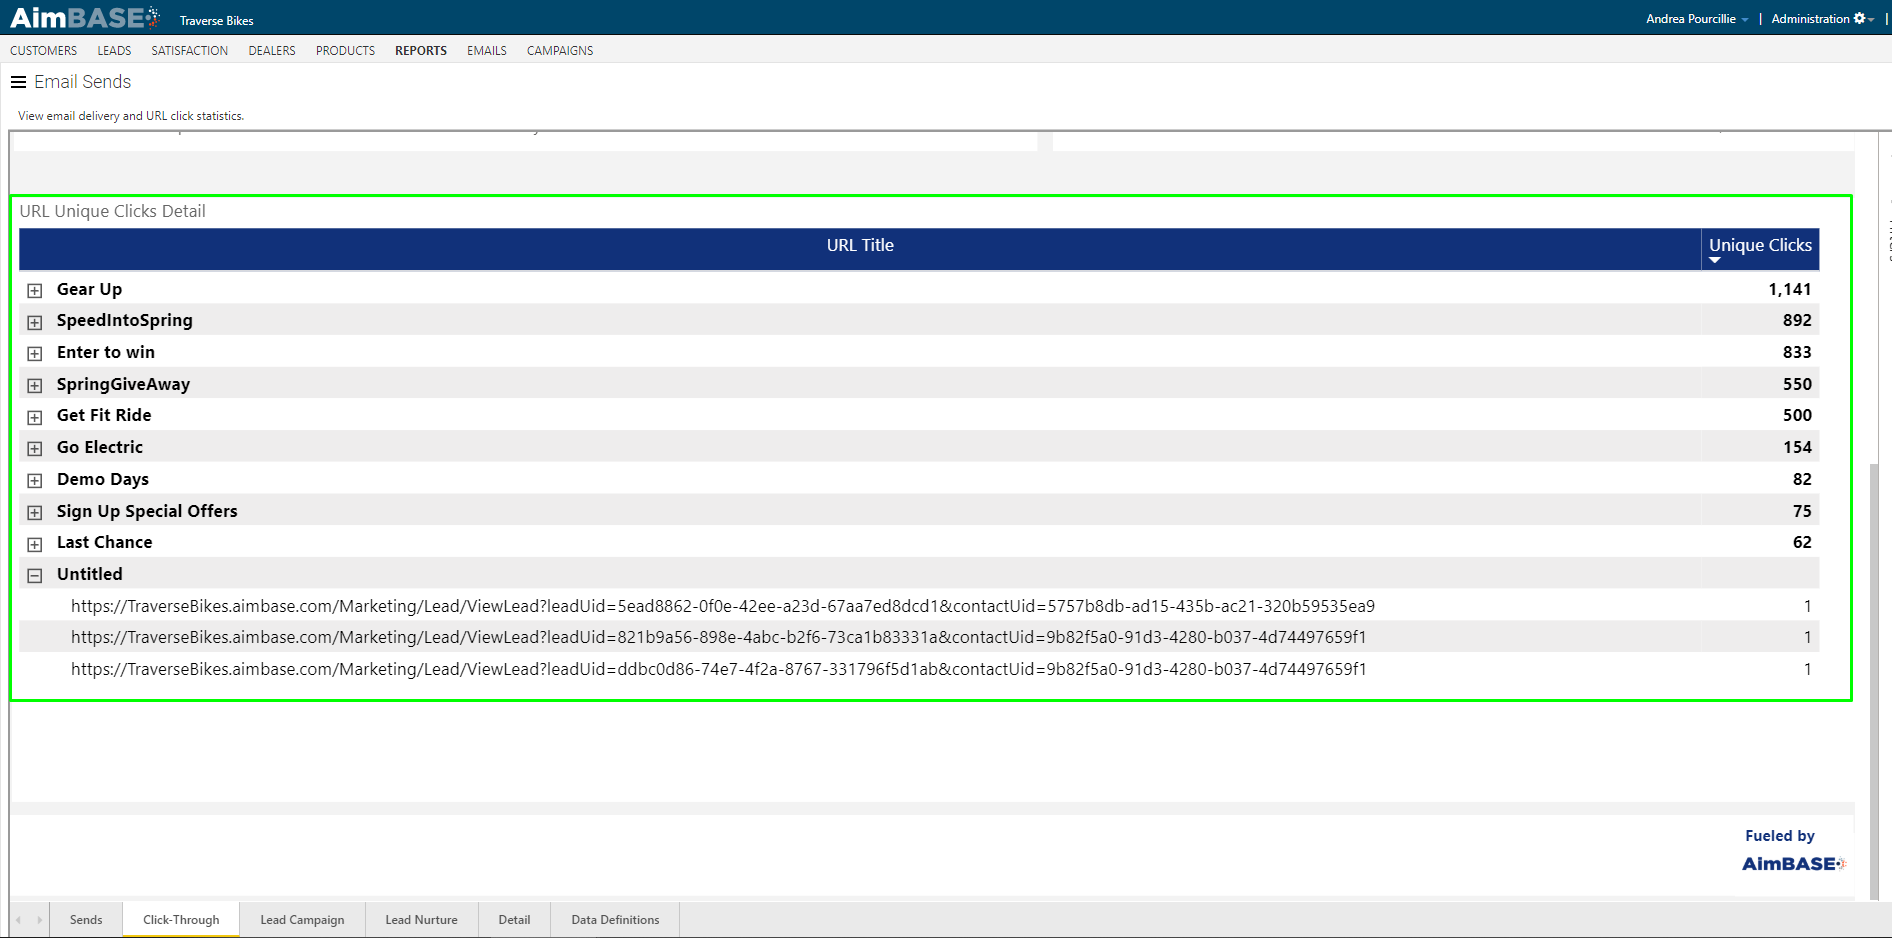
What does the URL Unique Clicks Detail section display?
Below, is additional detail about these titles. This list displays the link title along with the total number of unique clicks for the time period. If you expand each section you'll be able to see the full detail of each link associated with the title.
Watch the Email Sends Lead Campaign Video
What does the Lead Campaign tab show?
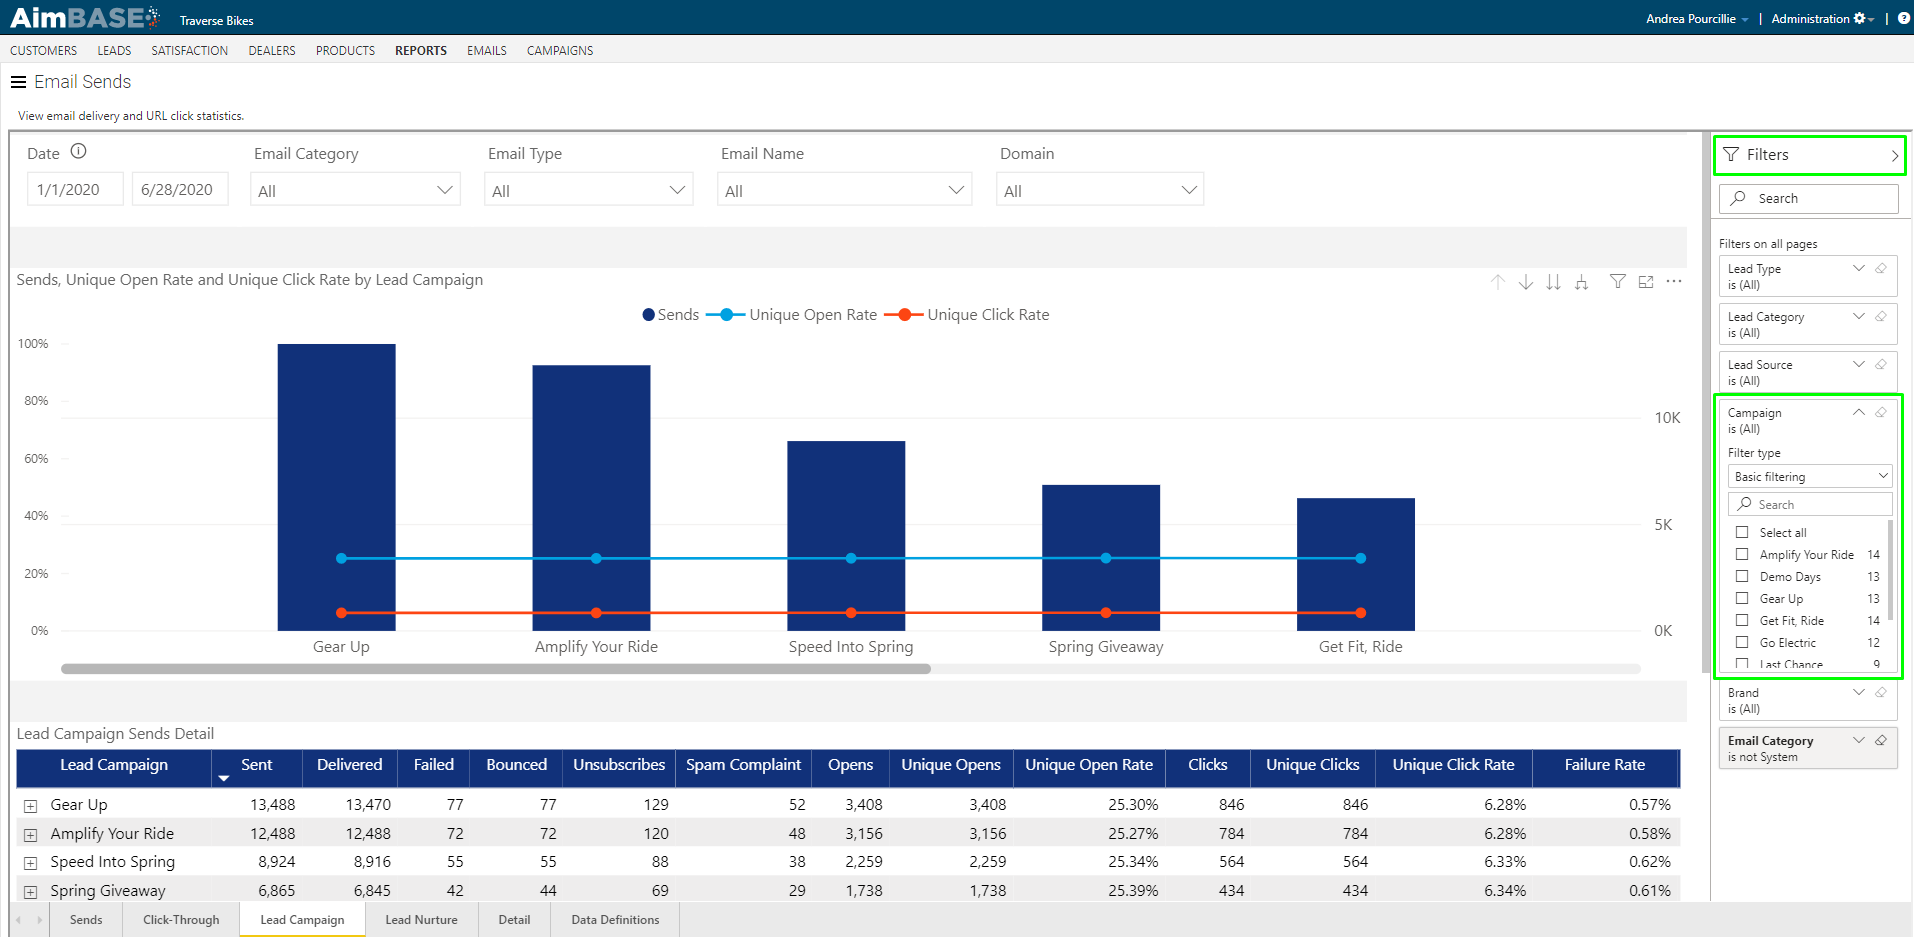
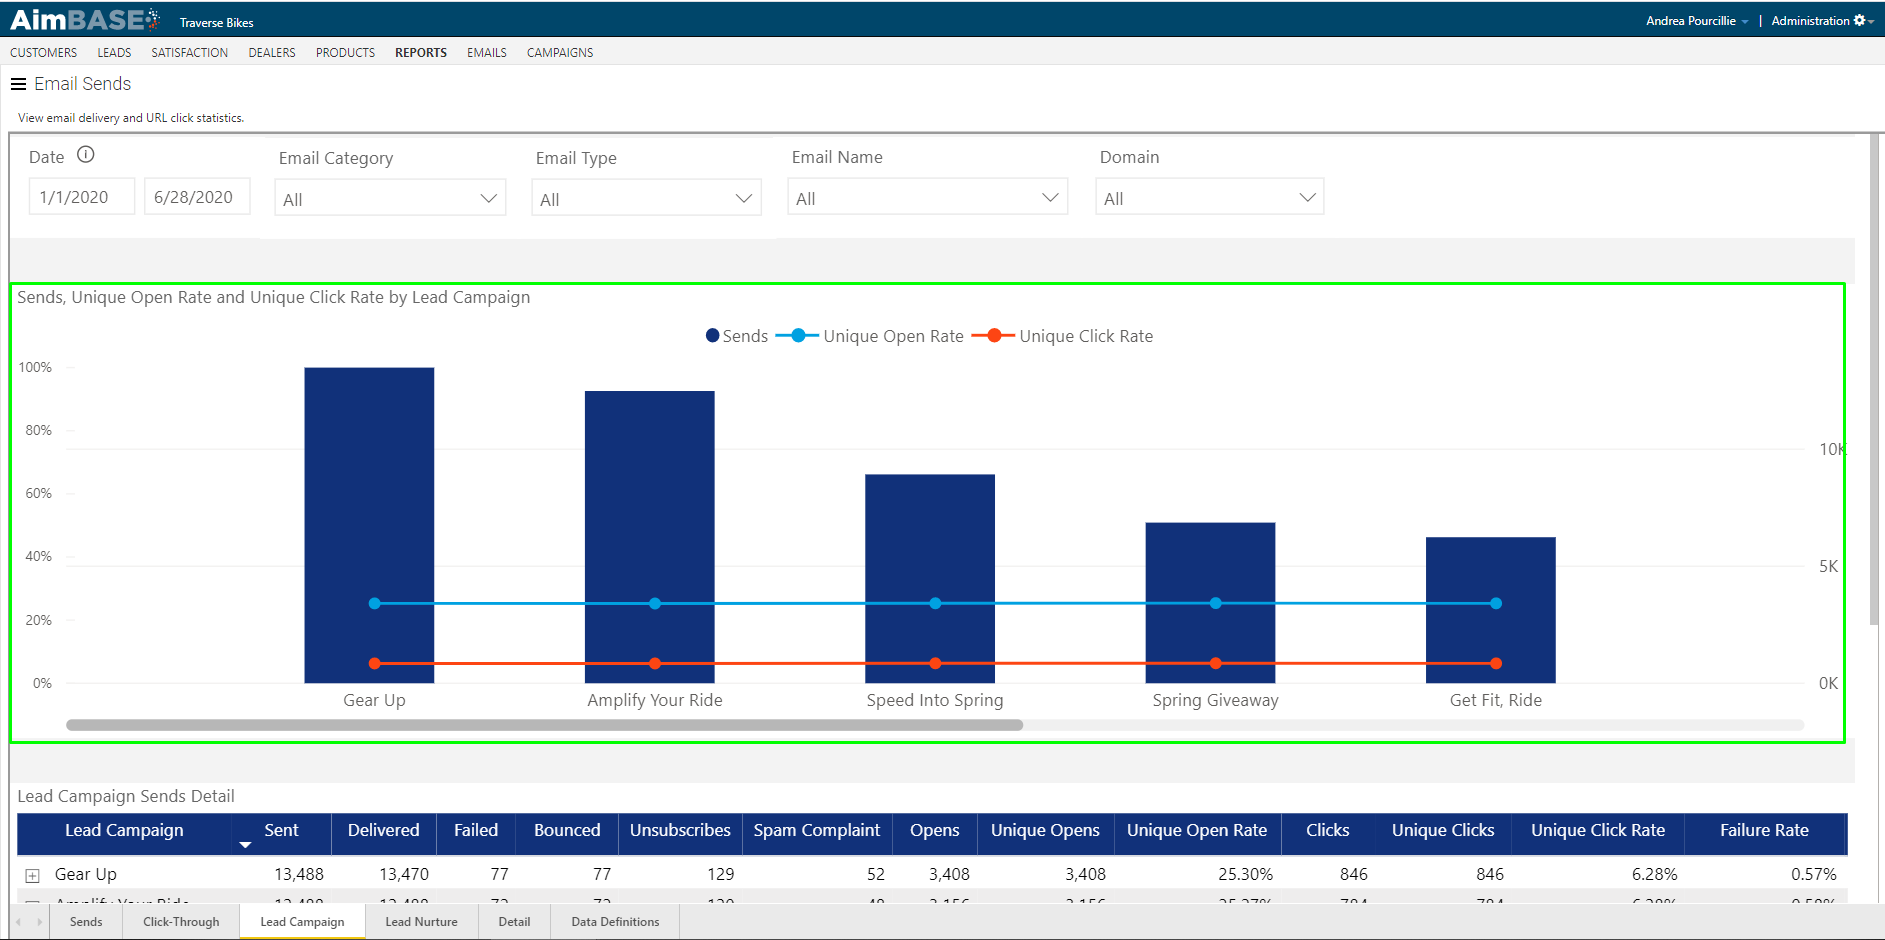
What does the Sends, Unique Open Rate, and Unique Click Rate by Lead Category section show?
This first module shows the volume of campaign emails sent organized by lead campaign along with the trends in unique open and unique click-through rates.
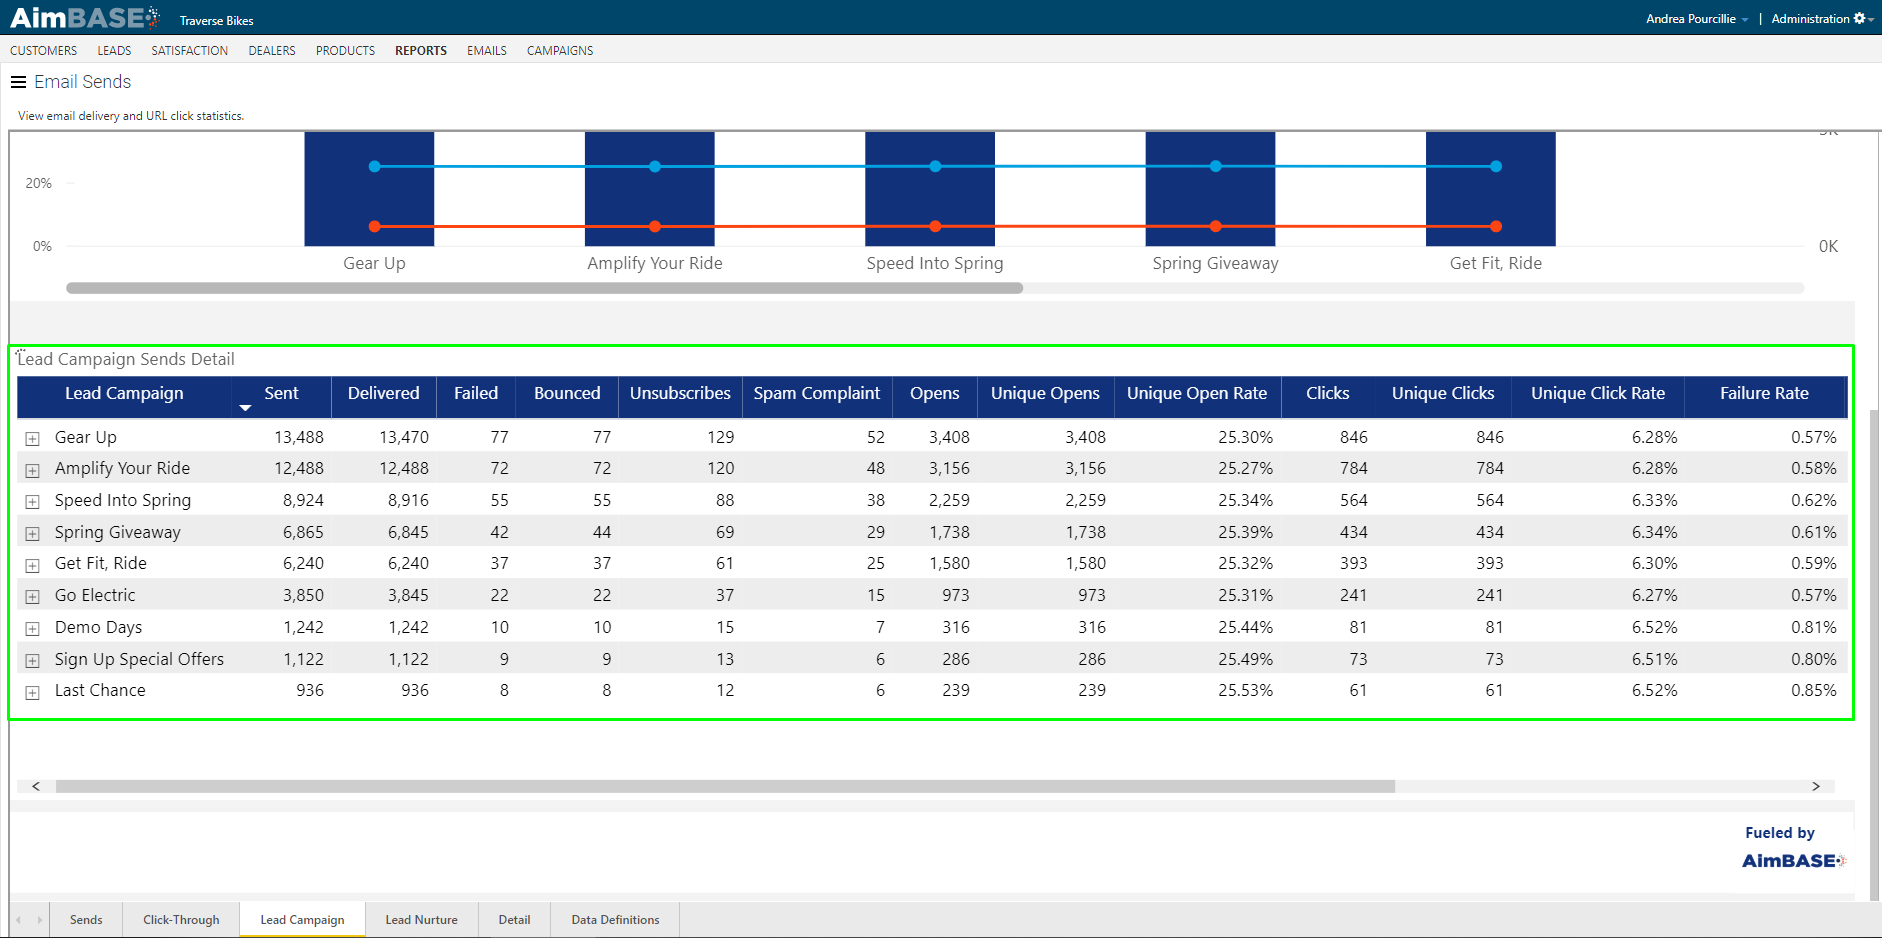
What does the Lead Campaign Send Detail section display?
At the bottom of the click-through tab, you'll find the send details for each lead campaign. By clicking on the + beside the name of each lead campaign you'll expose each send that's associated with the lead campaign along with the send details for each.
Watch the Email Sends Lead Nurture Video
What information is found in the Lead Nurture tab?
The information within the lead nurture tab provides data relating to nurture emails sent and which lead types, categories and sources triggered them.
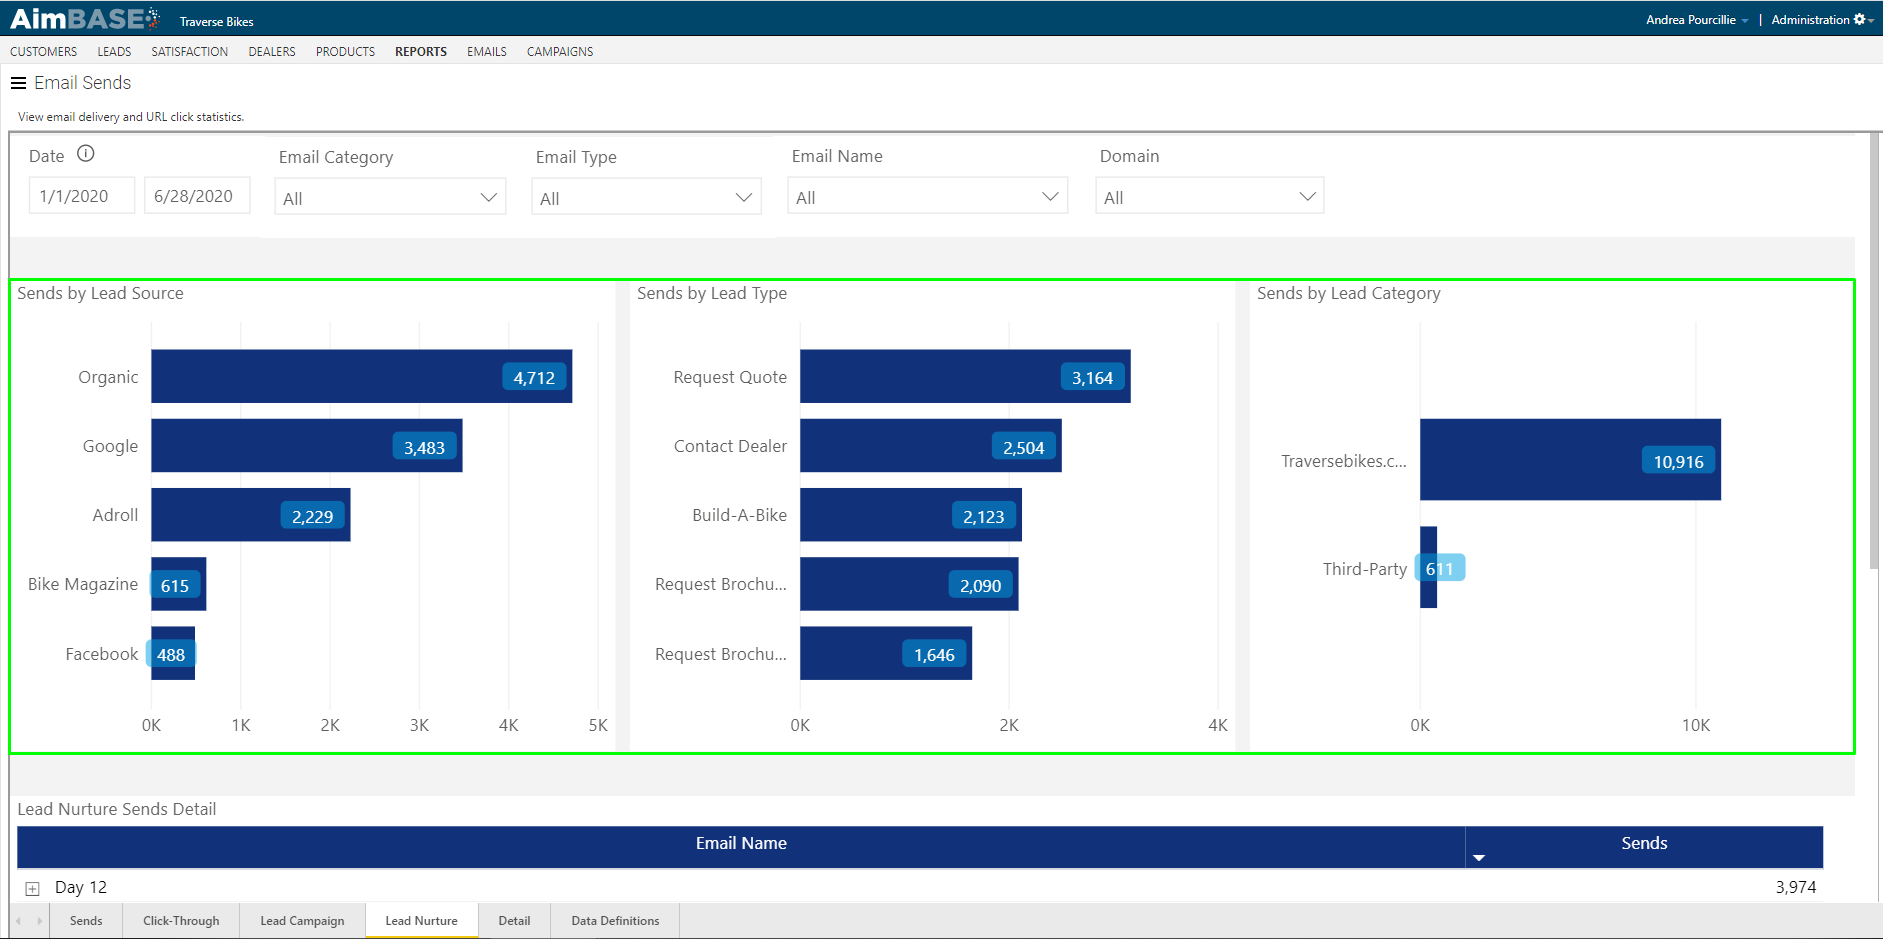
What do the Sends by Lead Source, Type, and Category modules show?
The modules within the first row of this tab break down by each classification how the nurture email was triggered to send to the consumer. Below are a couple of things to consider while viewing the data within these charts.
- The charts represent the number of emails sent, not the number of prospects within the nurture program.
- It is possible to set up different nurture programs based upon the lead source, type, and/or category a lead came from. If you have multiple nurture programs in use, keep in mind the duration and number of emails within the program when analyzing this data.
- Example: Nurture program 1 sends to leads with a lead type of Request a Brochure Download. The program includes 6 emails sent over a 365-day period. Nurture program 2 sends to leads with a type of Request a Quote. This program includes 6 emails sent over a 180-day period. Assuming that the number of leads collected for each lead type is comparable, the number of sends for Request a Quote would always be higher because the emails are being sent more frequently.
Watch the Email Sends Detail Video
What does the Details tab provide?
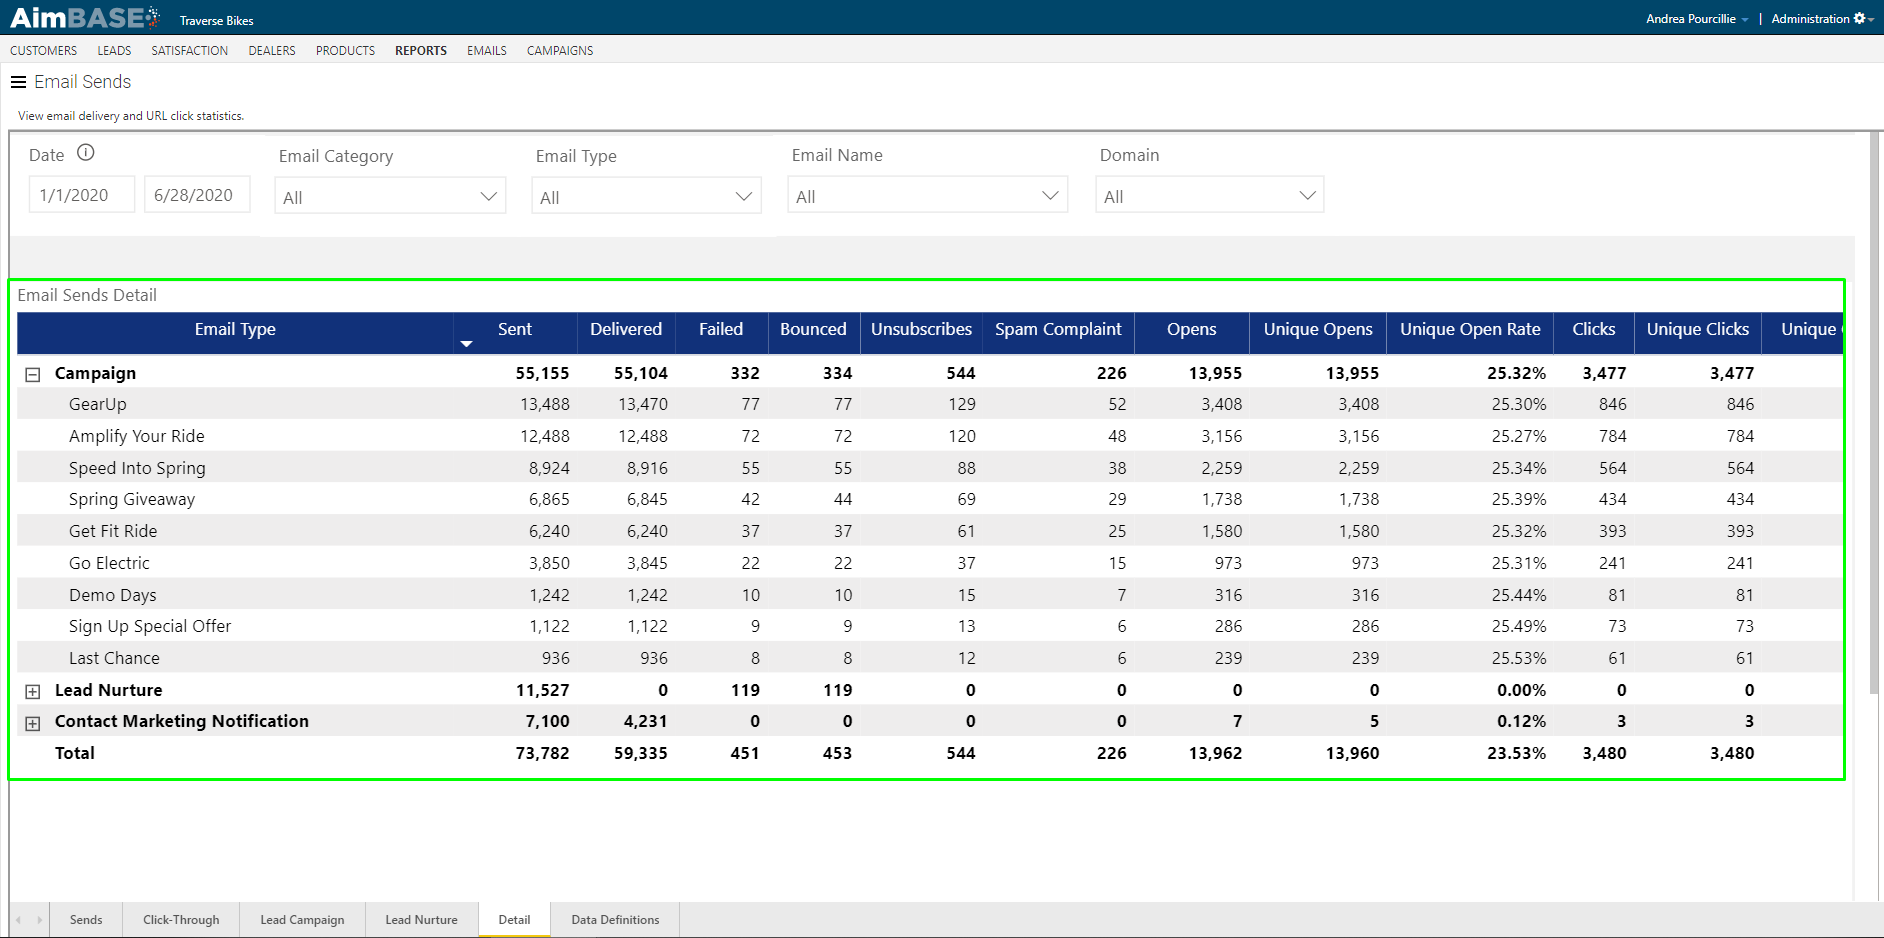
Within the details tab of the report, you'll find a list organized by email type that rolls up the key metrics for each email type. This allows you to understand high-level performance numbers for each. This is also a helpful page to utilize with filters. For example, if you launched a new nurture program you could use this tab to compare click-through rates from your old nurture program versus your new nurture program by simply adjusting the time frame of the report to mirror when the switch occurred.
By clicking the plus sign next to each row, the grid expands to display the more detailed metrics for each Email within the respective email type.
FAQs
What does the Email Sends Report show?
It shows email delivery and interaction performance, including how often emails are opened or clicked and what recipients clicked.
Does the Email Sends Report include dealer notification email data?
Yes, it includes open and click‑through data for dealer emails such as lead notifications, HIT activity, and hot alerts.
What does the Sends tab allow you to do?
It allows you to filter and narrow the data being reviewed, particularly by date range and email type.
Why is the date filter important on the Sends tab?
The date filter determines which email sends are included, and interactions that occur after the end of the date range will still appear if they relate to emails sent before that cutoff.
Which email types are selected by default when the report loads?
Lead Autoresponders, Lead Nurtures, and Campaign emails are selected by default.
Do filters affect all tabs in the report?
Yes. Any filter applied affects data on every tab of the report.
What KPIs are shown in the Email Sends Report?
KPIs include total sent emails, total delivered emails, delivery percentage, unique open rate, and unique click rate.
Why is the number of delivered emails lower than the number sent?
Delivery numbers are lower because some email addresses are invalid, inactive, full, or affected by autoresponders or other inbox issues.
What does unique open rate and unique click rate measure?
They measure the rate at which emails were opened or clicked by recipients, counting only the first open or click per recipient.
How is an email counted as opened?
An email is counted as opened only when its images are downloaded and visible to the recipient.
Why can open rate data be unreliable?
Open rate data can be affected by artificial factors such as bots that open emails automatically, inflating engagement metrics.
Is it possible to record a click without an open?
Yes. A click can occur without an open if images were not downloaded, since image download determines whether an open is recorded.
What does the Sends, Unique Open Rate & Unique Click Rate by Month view show?
It shows the volume of email sends relative to unique open and click rates over time.
What does the Email Activity section display?
It shows bounce rates, failed deliveries, unsubscribe rates, and the rate at which delivered emails were flagged as spam.
What does a failed email indicate?
A failed email usually indicates that the email address provided was not valid.
Why might an email bounce?
Bounces can occur due to full inboxes, temporarily inactive inboxes, or issues with the recipient’s email server.
What does the Sends by Email Category section show?
It shows the proportion of commercial and transactional emails sent.
What does the Sends by Email Type section show?
It breaks down email sends by type, such as campaign sends, lead nurture sends, lead autoresponders, and content marketing notifications.
What does the Sends by Domain section show?
It shows how email sends are distributed across the available email domains.
What does the Click Through tab show?
It shows which links within emails received the most clicks, organized by link title.
What does the Unique Clicks Trend by URL Title & Unique Clicks by URL Title section show?
It shows the top link titles receiving clicks and the trend of click volumes over time.
What does the URL Unique Clicks Detail section display?
It displays each link title along with the total number of unique clicks, and expanding a title reveals detailed clicks for each associated link.
What does the Lead Campaign tab show?
It shows send data for campaign‑type emails that were manually scheduled in Aimbase.
What is shown in the Sends, Unique Open Rate, and Unique Click Rate by Lead Category section?
It shows the volume of campaign emails sent by lead campaign and their unique open and click‑through rate trends.
What does the Lead Campaign Send Detail section display?
It shows each send associated with a lead campaign and the send details for each.
What information is in the Lead Nurture tab?
It provides data relating to nurture emails sent and which lead types, categories, and sources triggered them.
What do the Sends by Lead Source, Type, and Category modules show?
They show how nurture emails were triggered based on the lead’s source, type, or category.
What factors affect send volume in different nurture programs?
Send volume depends on how many nurture programs exist, their duration, and how many emails each program includes.
What does the Details tab provide?
It shows key metrics for each email type and allows drilling into metrics for each individual email within those types.
How can the Details tab be used with filters?
Filters can be applied to compare performance across different email programs by limiting the data to specific time frames.