Watch the Full Training Video for Using Reporting Tools

Filtering Your Report
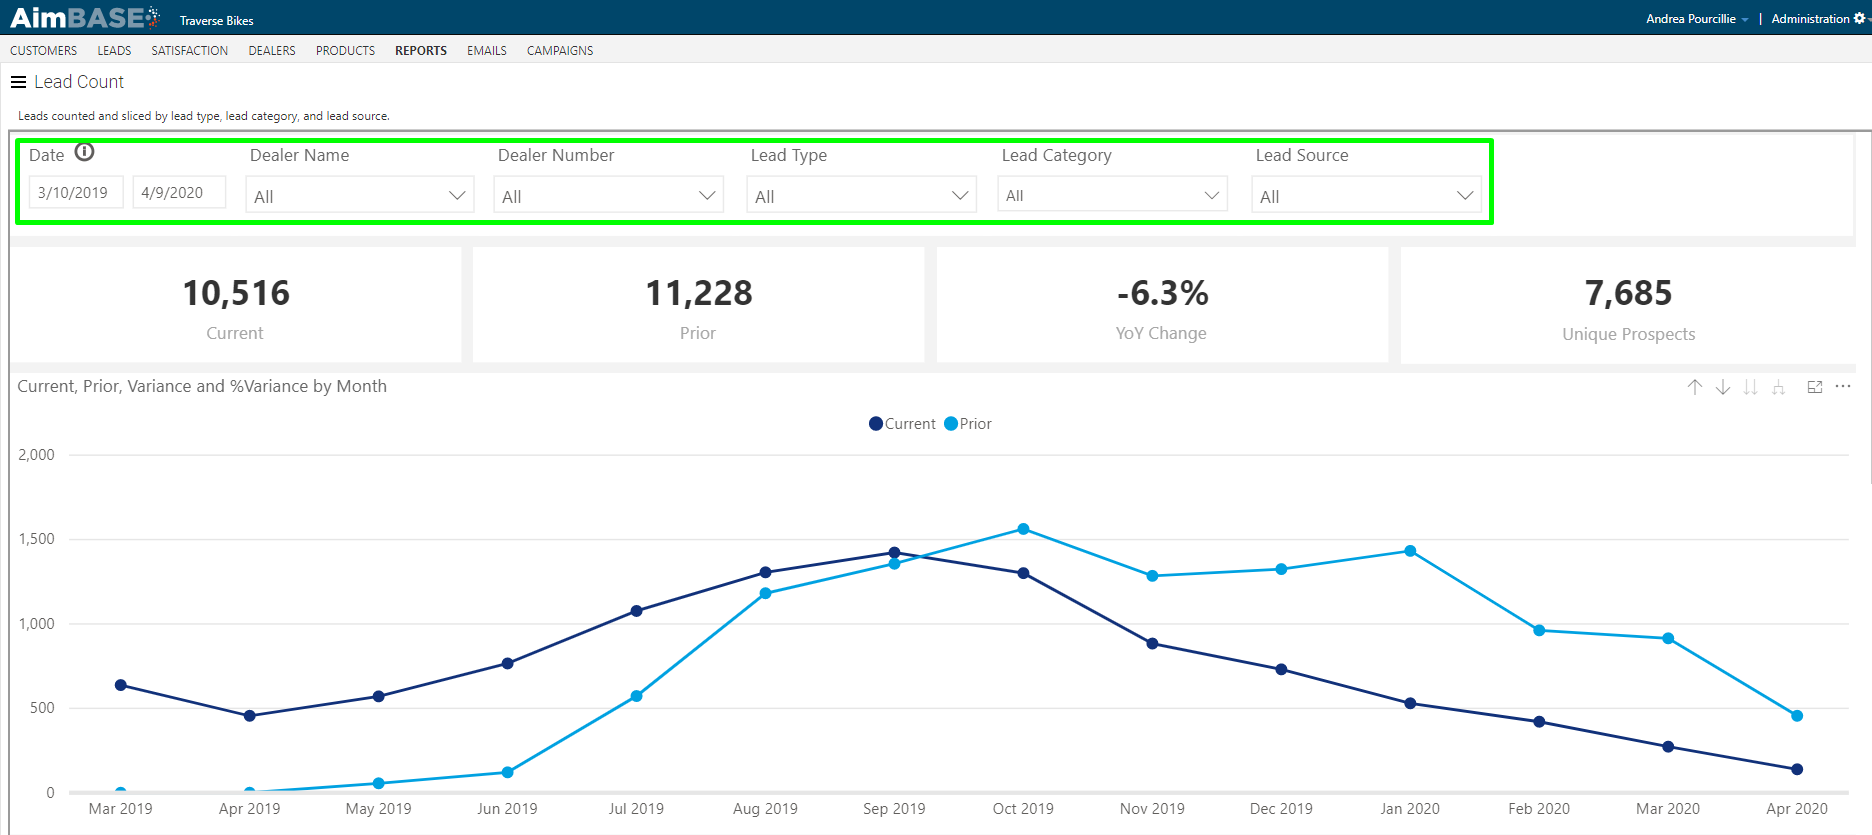
Within each report there are various ways to either filter the data sets or drill down deeper to get more detail about a specific report module. Before you can do anything, you must set your reporting filters.
Depending on the report you're viewing the set of filters may be different, but they all generally work the same.
Click into the date fields to set your time frame for the report. Note that reports are aggregated on a nightly basis; thus, report data us current through the prior day's activity.
When you click the arrow on each of the dropdowns you'll see the list of variables for that data type. Each will be selected by default. Unselect any that you would like to see removed from the data displayed within the report. Remember, these changes will impact the data in each subsequent tab. After a filter has a been applied, you'll notice a erase icon appears when you hover near the filter again. Clicking this will restore the filter to its default state.
See more about icons used throughout the Power BI reports below.
Icon Guide
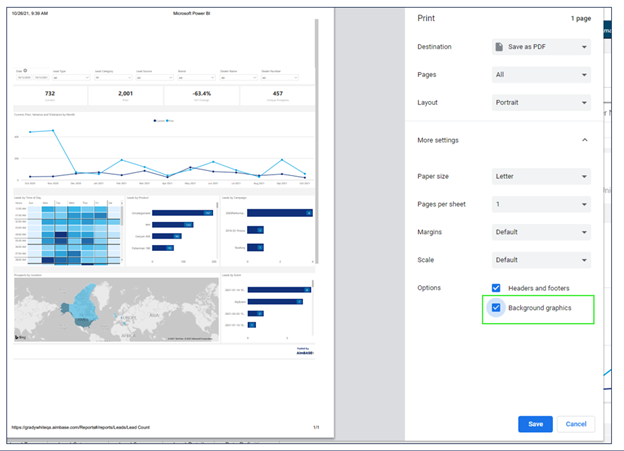
 Print. Users can print or save a report as a PDF. Some graphs will require the the background setting to be turned on to display like it does in the report (i.e. heat maps). If a PDF is trying to be added to a PowerPoint, it can be dragged and dropped. If a PDF is being added to a Word document then it needs to be opened in word to display.
 - Clear selections. Used with filters; when clicked, the eraser icon will remove and filters setup by the user and revert the report to its default selections.
 - Focus mode. Available for most report modules, when clicked focus mode will all the module to take up the entire screen. To exit focus mode, click Back to Report in the top-left corner of the screen.

 - Drill mode. The ability to use drill mode varies by module. Whether or not you can drill up or down with the data depends on at which level your are currently viewing that data. The data hierarchies for reports are Month, Quarter, and Year.
- Selecting the
 allows you to move one hierarchy level up. For example, if the data you're viewing is reported by month, clicking this icon will allow you to view it by quarter.
 - Clicking on
 takes you to the next level down for the hierarchy. An example of this is if you're looking at data reported by year, clicking the double down arrows will display the data by quarter.
 - Clicking on
 will add an additional hierarchy level to the current view. If a chart displays yearly data, then clicking on will display yearly and quarterly data.
 - Clicking on
 provides an option to drill down one field at a time by selecting a visual element. To use this feature, click on the down arrow in the module you're viewing, then click on the data point you'd like to drill down into.
 - More options. Clicked the ellipses allows you to see additional options for interacting with a module. See more options below.
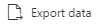 - Clicking Export data allows you to view the data in an Excel spreadsheet or CSV.
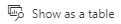 - Using the Show as a table option will alter the view to include the typical module, but it will also include that data formatted as a table for easy reading.
-
 - Switch to vertical layout. If you're using the Show as a table option, the Switch icon will become available. This allows you to view the table to the right of the original graph or chart instead of below it.
 - Spotlight allows you to bring the report module to the foreground. When using Spotlight mode all other modules of the report are blurred out, allowing you to bring attention to the module of importance.
 - Link to data. This icon allows you to navigate directly to the details page with the respective section of Aimbase for a record being reported on when clicked.
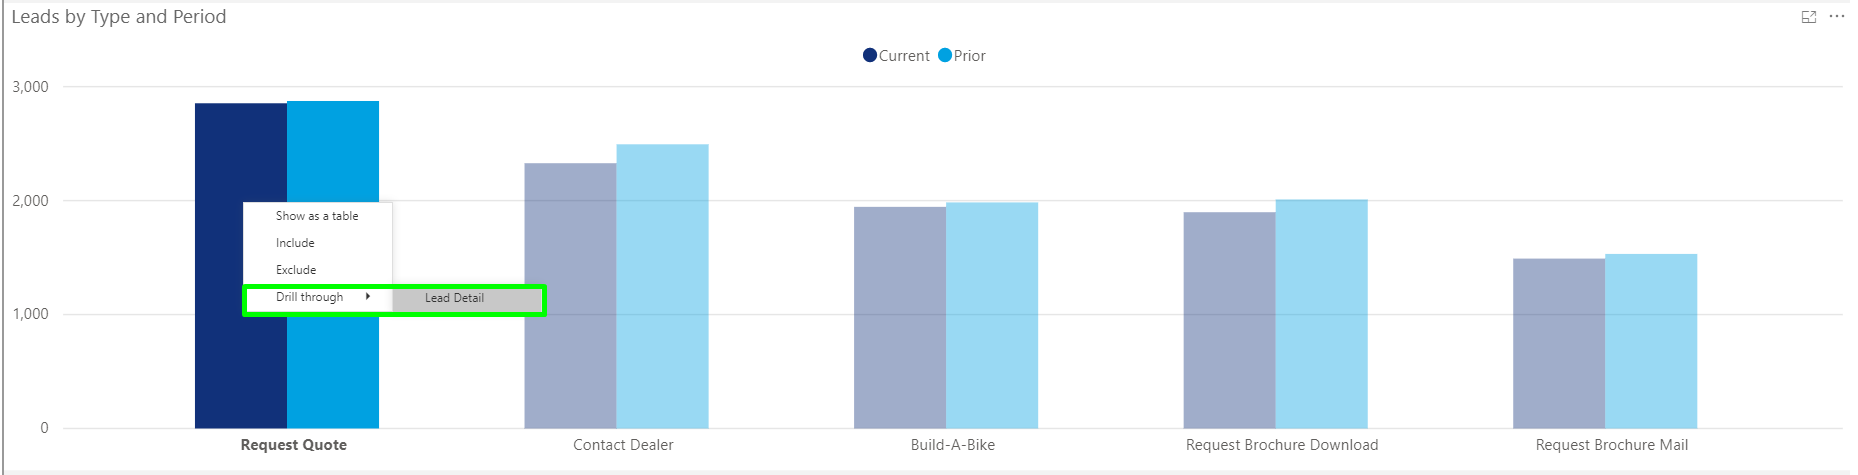
The reports also feature a Drill through option. On certain types of graphs, users have the ability to right-click on a visual element. By hovering over Drill through and then selecting the next available option, the report will take you to a more focused page to get details about the data relating to the visual element selected.
Frequently Asked Questions
What are report drill-downs?
Report drill-downs allow you to view data at different levels of a hierarchy within a Power BI report. Depending on the report module, you can move up or down through the available hierarchy levels to see more summarized or more detailed information.
How do I start using drill-down functionality?
Before using drill-down features, set your report filters. Once your filters are applied, use the drill icons available within supported report modules to navigate through the report hierarchy.
Can every report module be drilled into?
No. The ability to use drill mode varies by module. Whether you can drill up or down depends on the specific module and the hierarchy level currently being displayed.
What hierarchy levels are available in reports?
The report hierarchies are:
- Year
- Quarter
- Month
These hierarchy levels allow you to move between broader and more detailed views of your data.
How do I view data at a higher level?
Use the drill up icon. For example, if data is currently displayed by month, drilling up allows you to view the same information aggregated by quarter.
How do I view data at a more detailed level?
Use the drill down icon. For example, if data is displayed by year, drilling down lets you see the data broken out by quarter.
What does the double-down-arrow drill icon do?
The double-down-arrow icon displays the next level of the hierarchy. For example, if you are viewing data by year, selecting this icon will display the data by quarter.
Can I add another hierarchy level to my current view?
Yes. One of the drill options adds an additional hierarchy level to the current view, allowing you to see multiple levels of the hierarchy together.
What should I do if my report is difficult to read while drilling into data?
You can use Focus Mode on supported report modules. This enlarges the module to occupy the full screen, making it easier to analyze the data while drilling into different hierarchy levels.
Will report filters affect my drill-down results?
Yes. Any filters you apply affect the data displayed throughout the report, including the information shown when you drill up or drill down.
How do I reset my filters after drilling into data?
Hover over the filter and select the eraser (clear selections) icon. This restores the filter to its default settings.
Can I print or save a report after drilling into the data?
Yes. Reports can be printed or saved as a PDF. The report will reflect the view that is currently displayed when you print or save it.
Is report data updated in real time?
No. According to the article, report data is aggregated nightly and reflects activity through the previous day. Power BI reports refresh using a single job and are limited to prior-day data.